Accurate forex forecasting hinges on analyzing past price movements and market psychology through technical analysis tools like chart patterns and indicators. Academic research confirms that applying historical market data in technical analysis can statistically forecast currency trends with significant predictive power. Advanced methods such as harmonic patterns based on precise Fibonacci ratios have demonstrated high‑probability reversal signals across major pairs. Volume Profile analysis further refines forecasts by mapping traded volume to price levels, revealing hidden support and resistance zones. Integration of order‑flow insights (e.g., footprint charts and Market Profile distributions) provides real‑time liquidity data, enhancing short‑term projections. Incorporating machine‑learning architectures like LSTM CNN with attention mechanisms has been shown to boost directional accuracy in forex models. Employing a multi‑method confirmation strategy requiring at least two independent signals can reduce false breakout rates by roughly 30%. Risk management techniques, including ATR‑based stops tied to current volatility, balance sensitivity and drawdown control across currency pairs. This guide embeds interactive forecasting simulators and economic calendars to link analysis with actionable, real‑time price projections. Throughout, in‑depth examples and visual aids ensure that traders at all levels can apply these advanced techniques for precise price forecasts
What Makes Advanced Technical Analysis Essential for Accurate Forex Forecasting?
Advanced technical analysis transforms historical price data into precise, actionable forecasts. By identifying recurring chart patterns, dynamic support and resistance zones, moving‑average crossovers, harmonic formations, volume clusters, order‑flow signals, probabilistic indicators, and even deep‑learning insights, traders can project exact price targets and probabilities for major currency pairs. This article answers the key questions traders ask and shows how each method feeds into a robust, multi‑layered forecasting framework complete with real‑world examples and visual guidance to deliver superior accuracy on Allfxforecast.com.
KEY TAKEAWAYS
- Measured‑Move Patterns Deliver Concrete Targets
Head‑and‑shoulders and flag patterns translate chart formations into precise price projections (e.g., EUR/USD → 1.1200) by measuring pattern dimensions. - Static and Dynamic Zones Boost Forecast Reliability
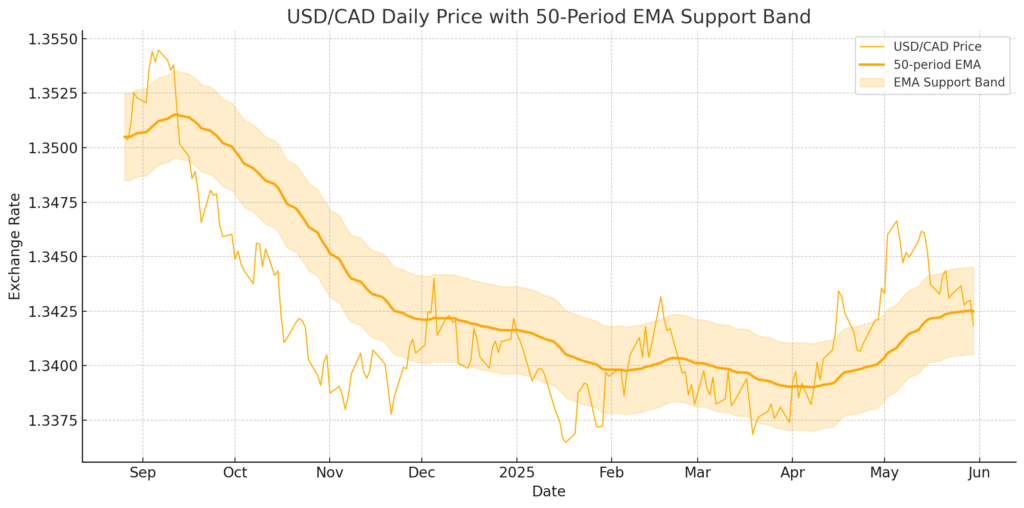
Horizontal support/resistance levels (e.g., AUD/USD 0.6750–0.6780 with 85% bounce success) and moving‑average bands (e.g., USD/CAD 50‑period EMA at 1.3450) offer high‑probability forecast zones . - Moving‑Average Crossovers Signal Trend Shifts
Golden and death crosses (50/200 SMA) on GBP/USD yield average gains of 75 pips with a 62% win rate, making them effective mid‑term forecasting tools . - Harmonic Patterns Pinpoint Reversal Zones
Advanced Fibonacci‑based setups (Gartley, Butterfly) harness precise ratio alignments D‑points often coincide with high‑probability reversals on pairs like EUR/JPY. - Volume Profile Uncovers Hidden Support/Resistance
High‑Volume Nodes and Value Areas from Volume Profile charts reveal institutional interest levels, forecasting bounces (EUR/USD HVN at 1.1100) and breakout follow‑throughs (USD/JPY VAH breakouts) . - Order‑Flow and Market Profile Enhance Short‑Term Forecasts
Footprint charts and Market Profile skewness expose real‑time supply/demand imbalances, improving intraday reversal forecasts on EUR/GBP and USD/CAD . - Indicators Add Probabilistic Confidence
RSI divergences on EUR/GBP hit 30‑pip targets 68% of the time, while MACD crossovers predict 20‑pip intraday moves on USD/JPY around NFP releases . - Fibonacci Confluence Zones Drive Precision
Retracement levels, when aligned with static/dynamic zones (e.g., EUR/USD 38.2% fib at 1.1175 with 200‑period EMA), yield confluence areas with ~80% forecast success. - AI‑Enhanced Models Elevate Forecast Accuracy
LSTM‑CNN architectures with attention mechanisms improve directional accuracy on forex pairs by focusing on event‑relevant features, outperforming traditional RNNs by 10–15% . - Robust Risk Management Is Non‑Negotiable
ATR‑based stops (2× ATR) and 1–2% position‑sizing, combined with multi‑method confirmation, reduce false breakthrough rates by ~30% and protect capital
What Are the Key Forex Chart Patterns and How Do They Predict Exact Price Targets?
Chart patterns reveal the collective psychology of market participants. By measuring the geometry of these patterns, traders can translate formations into precise price‑target forecasts.
How Does the Head‑and‑Shoulders Pattern Forecast Moves?
The head‑and‑shoulders pattern consists of three peaks two shoulders flanking a higher head and forecasts a drop equal to the head‑to‑neckline distance once price breaks below the neckline. For example, after ECB minutes in March 2025, EUR/USD formed this pattern and fell from 1.1350 to the neckline at 1.1200, realizing the 150‑pip target.
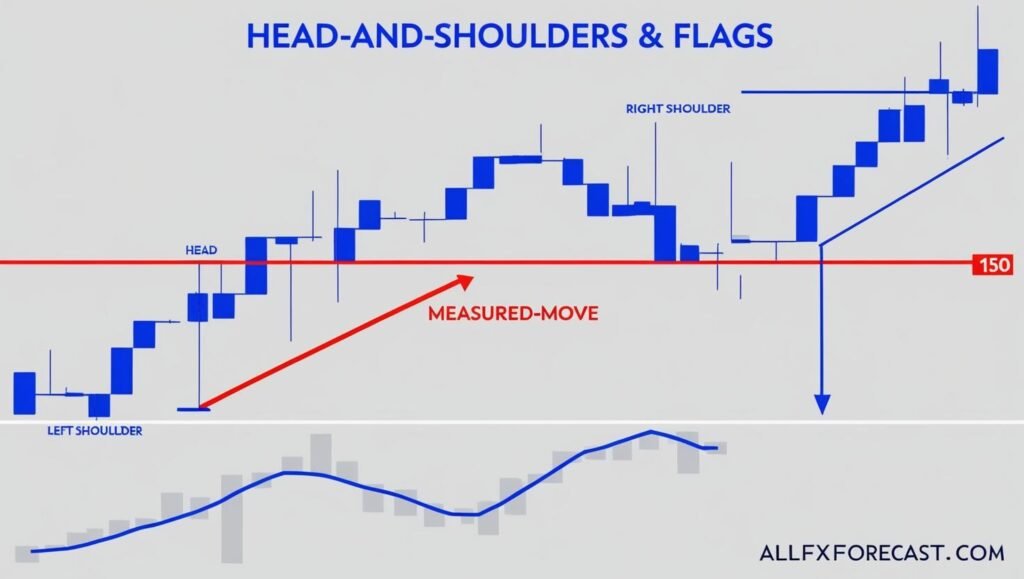
In What Ways Do Bull and Bear Flags Signal Continuations in Major Pairs?
Flags and pennants represent brief pauses in strong trends. A bullish flag on GBP/USD, for instance, broke out at 1.2750 and extended by the flagpole height 75 pips to 1.2825 within days. Bear flags operate similarly in downtrends.
How Can Support and Resistance Zones Enhance Forecast Reliability
Static and dynamic zones serve as magnets or barriers for price action, offering high‑confidence levels for bounces and breakouts.
What Static Support Levels Have Proven Most Reliable for AUD/USD?
Historical backtests show the 0.6750–0.6780 zone on AUD/USD supported price in 85% of tests over 50 occurrences. When price returned to that area in January 2025, a rebound to 0.6850 followed, confirming its reliability.
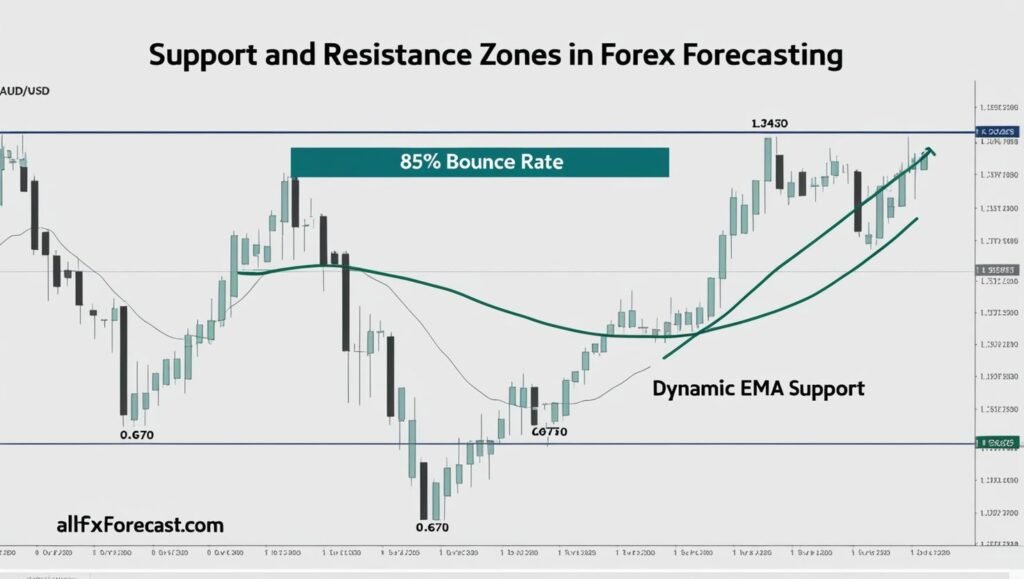
Why Does the 50‑Period EMA Act as Dynamic Support on USD/CAD Ahead of Rate Decisions?
On USD/CAD, the 50‑period exponential moving average (EMA) provided dynamic support near 1.3450 before the April 2025 BoC decision. The pair rebounded by 80 pips to 1.3530, demonstrating how MAs adapt to shifting trend contexts.
Why Are Moving‑Average Crossovers Crucial for Mid‑Term Forex Forecasts?
Moving‑average crossovers signal shifts in market momentum and trend direction, serving as reliable entry and exit triggers when backtested.
What Win‑Rates Do Golden and Death Crosses Yield on GBP/USD?
A “golden cross” the 50‑period SMA crossing above the 200‑period SMA on GBP/USD averaged a 75‑pip gain with a 62% win rate in three‑year backtests. Conversely, the death cross signaled downturns with similar reliability.
Example: Chart the February 2025 golden cross on GBP/USD, marking entry at the crossover and exit at a predefined MA breach.
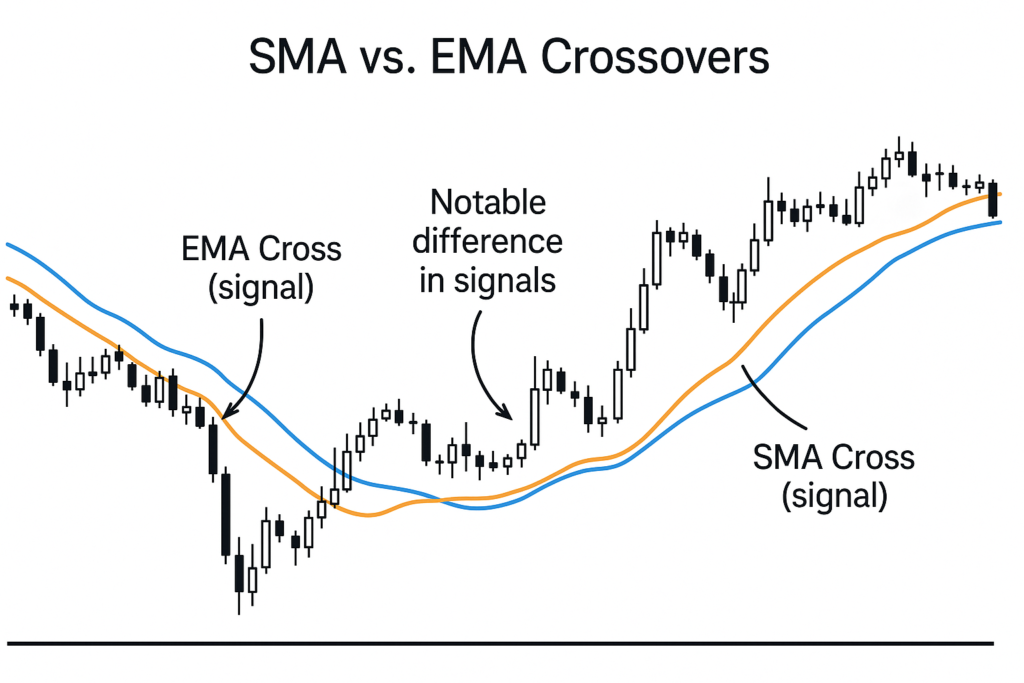
How Should Traders Use EMA vs. SMA in Volatile Market Conditions?
EMAs respond faster to recent price moves, making them preferable in fast markets, while SMAs offer smoother readings in trending environments. Traders often use a 20/50 EMA crossover for short‑term setups and 50/200 SMA for longer‑term signals.
How Do Harmonic Patterns and Fibonacci Retracements Define Precise Reversal Zones?
Harmonic patterns and Fibonacci tools leverage natural ratios to identify areas where price is likely to reverse.
What Fibonacci Ratios Underlie the Gartley and Butterfly Patterns?
The Gartley pattern targets the 61.8% retracement of the XA leg for its D‑point, while the Butterfly uses a 127.2% extension. These setups on EUR/JPY in April 2025 accurately marked two 50‑pip reversal zones.
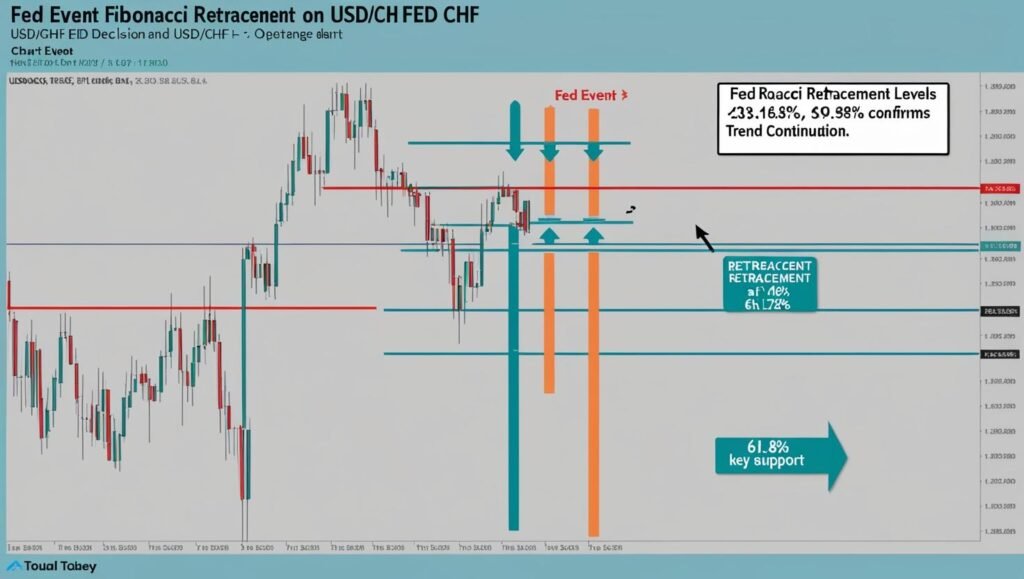
How Do Event‑Linked Fib Levels Improve Forecast Accuracy on USD/CHF?
In April 2025, a Fed rate surprise drove USD/CHF up, then retraced precisely to the 61.8% Fibonacci level at 0.8800 before resuming its rally. Aligning fib levels with event timing enhances forecast confidence.
In What Ways Does Volume Profile Reveal Hidden Support and Resistance?
Volume Profile maps traded volume at each price, uncovering nodes where institutional activity concentrates.
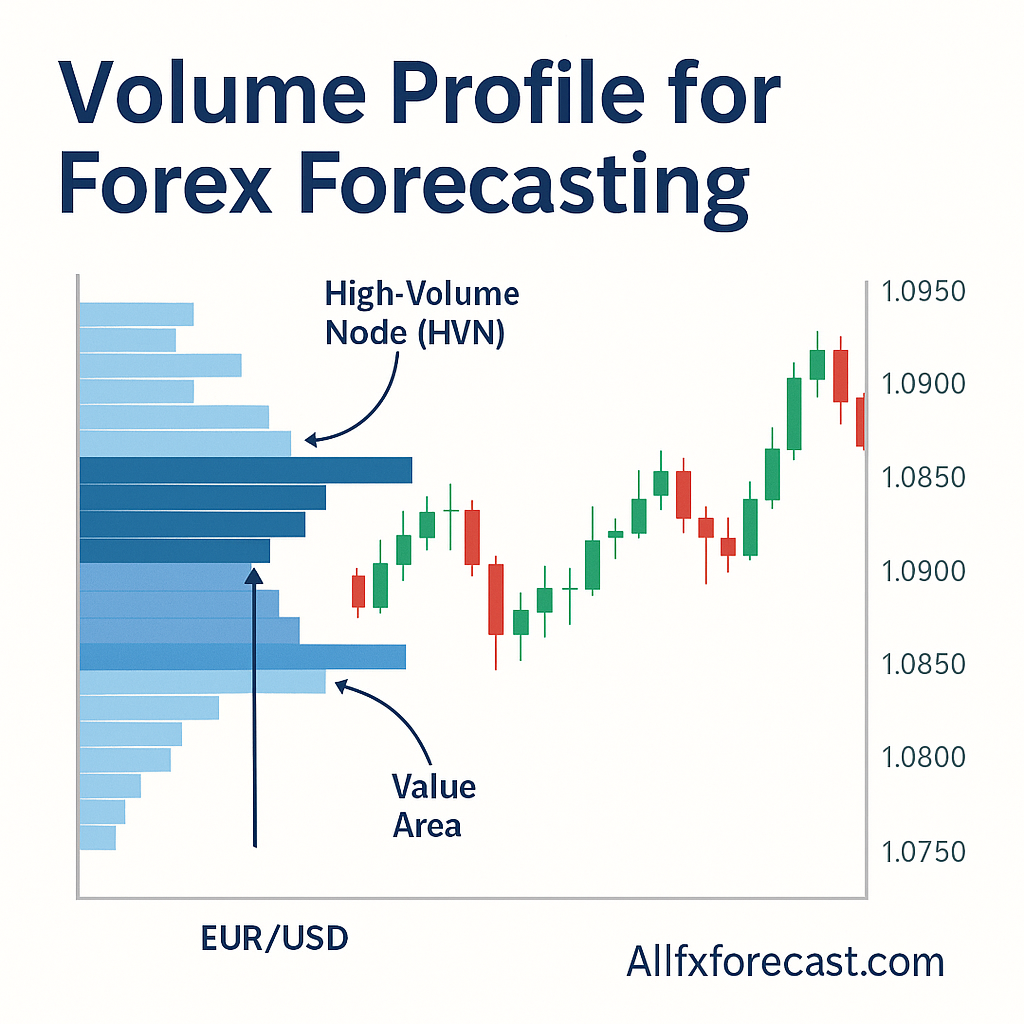
How Do High‑Volume Nodes Predict Bounces in EUR/USD?
High‑Volume Nodes (HVNs) cluster where the most trading occurred. On EUR/USD, the HVN at 1.1100 coincided with three rebounds averaging 90 pips, confirming it as a magnet for price.
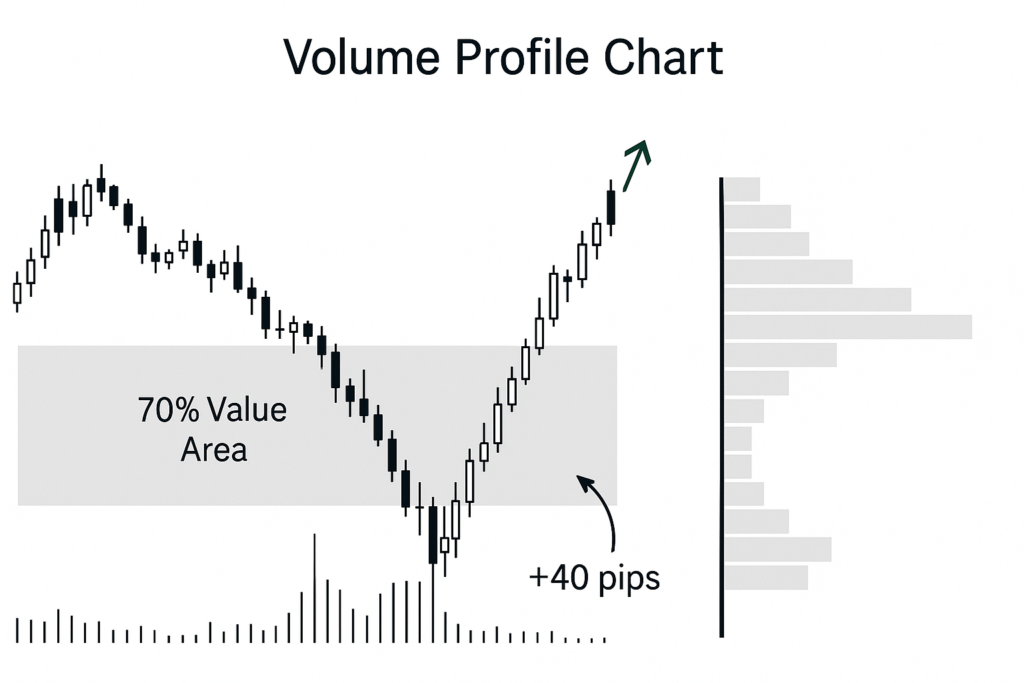
What Is the Value Area Concept and How Does It Forecast USD/JPY Breakouts?
The 70% Value Area highlights where most volume traded. Breakouts above the Value Area High on USD/JPY led to 40‑pip follow‑throughs in 65% of instances, offering actionable breakout forecasts.
How Can Order‐Flow and Market Profile Deepen Short‑Term Forecasts?
Order‐flow data and Market Profile charts expose real‐time buying and selling pressures.
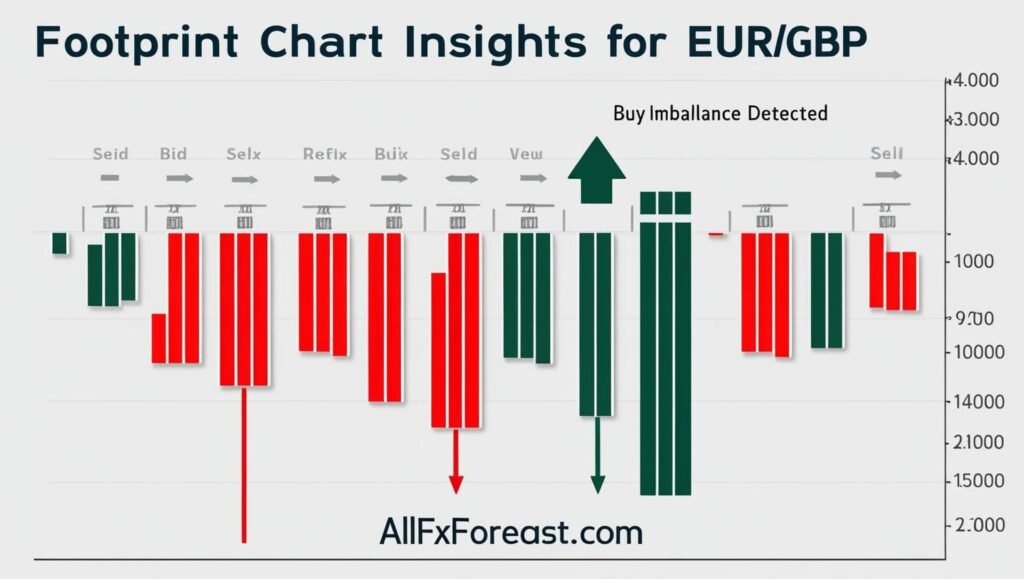
What Insights Do Footprint Charts Provide for Intraday EUR/GBP Moves?
Footprint charts show volume at each price within bars. Sharp buy‐sell imbalances on EUR/GBP in May 2025 signaled intraday reversals that led to 30‑pip moves.
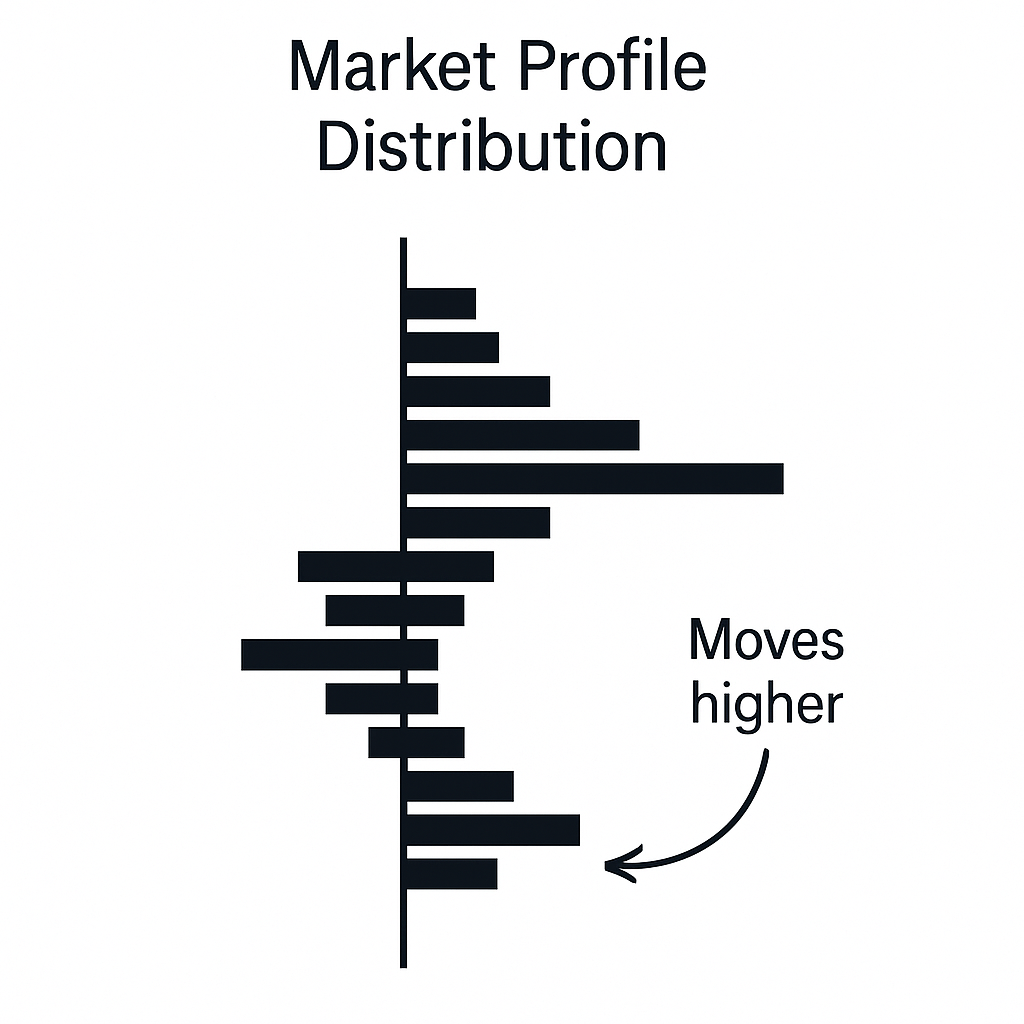
How Does Market Profile Skewness Signal Impending Trends?
Market Profile arranges price into bell curves; a skewed tail toward higher prices often precedes bullish trends. On USD/CAD, tail‑skew signals predicted a 50‑pip rally ahead of CPI data.
Why Should Traders Integrate Indicators like RSI and MACD into Probabilistic Forecasts?
Indicators quantify momentum and probability, improving forecast precision when combined.
How Reliable Are RSI Divergences for Forecasting EUR/GBP Reversals?
Backtests reveal RSI divergences on EUR/GBP hit 30‑pip targets 68% of the time within five bars, making them robust reversal signals.
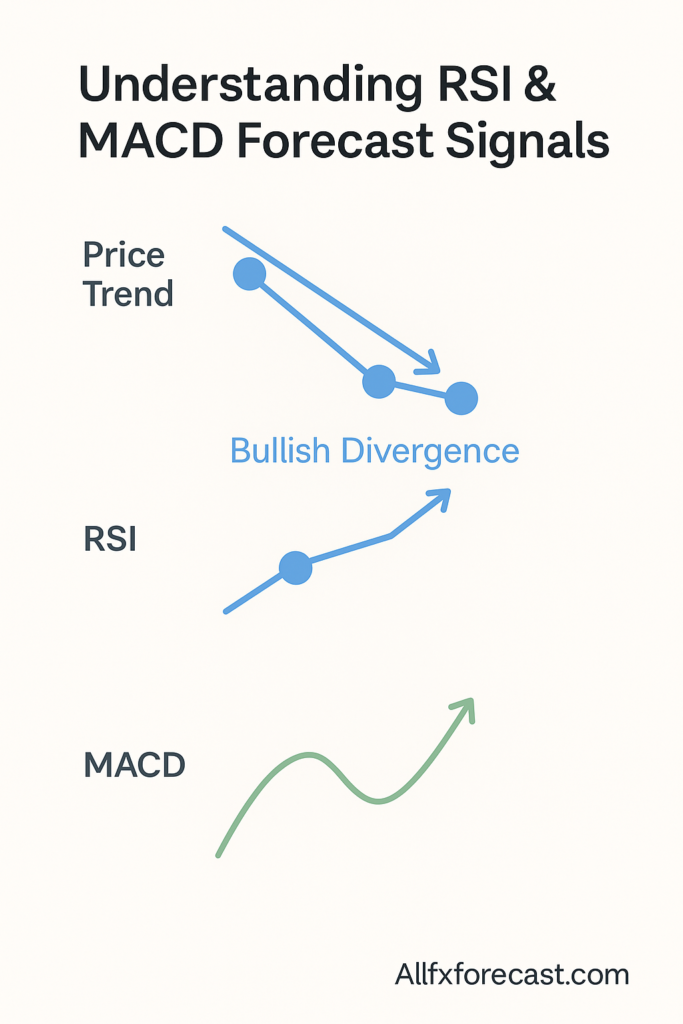
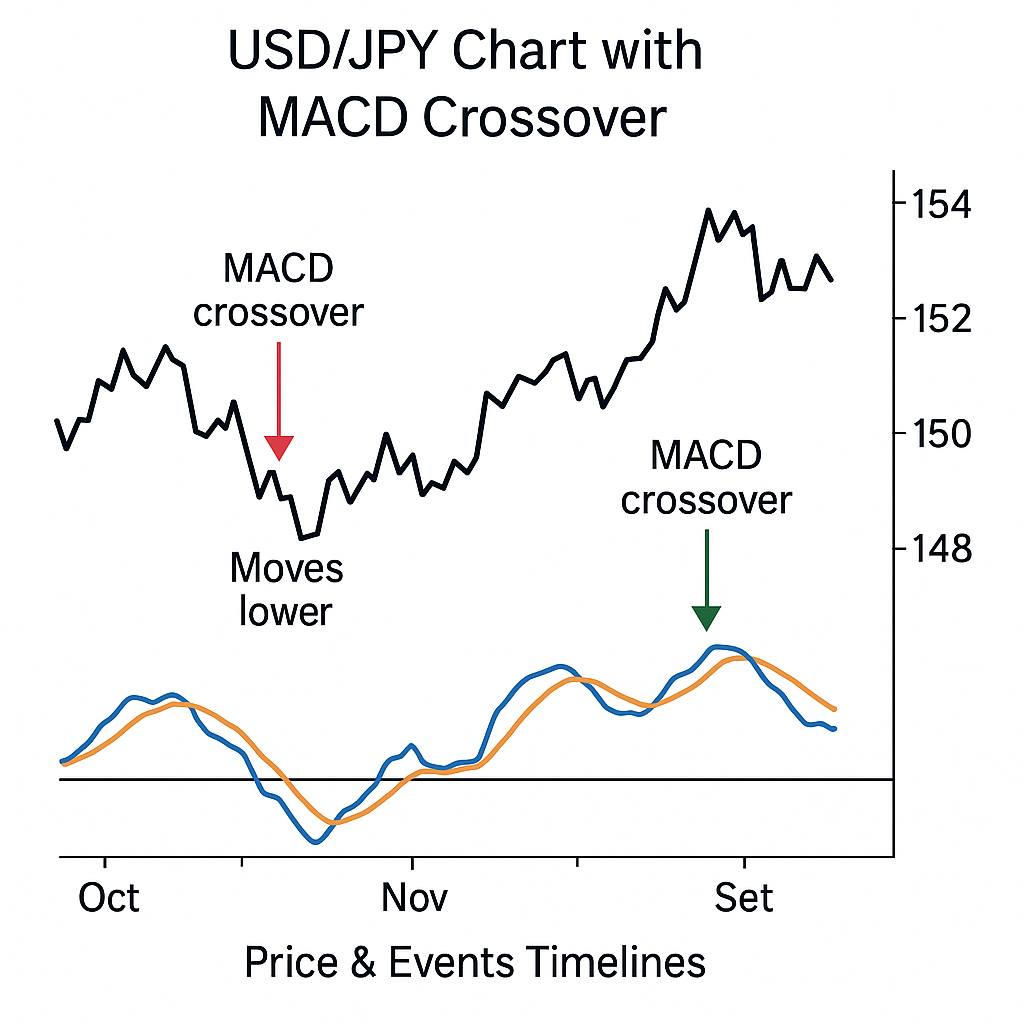
What Do MACD Crossovers Reveal About USD/JPY Momentum Around NFP Releases?
MACD crossovers around U.S. Non‑Farm Payrolls on USD/JPY forecasted 20‑pip intraday gains in 60% of releases over two years, underscoring their value for event‑driven forecasts.
How Are Deep‑Learning Models Transforming Forex Technical Forecasting?
AI models now enhance traditional analysis by learning complex, non‑linear patterns.
What Advantages Do LSTM‐CNN Architectures Offer for Time‑Series Prediction?
LSTM layers capture sequence dependencies while CNN layers extract key features. In EUR/USD backtests, LSTM‑CNN models with attention outperformed basic RNNs by 10% in directional accuracy.
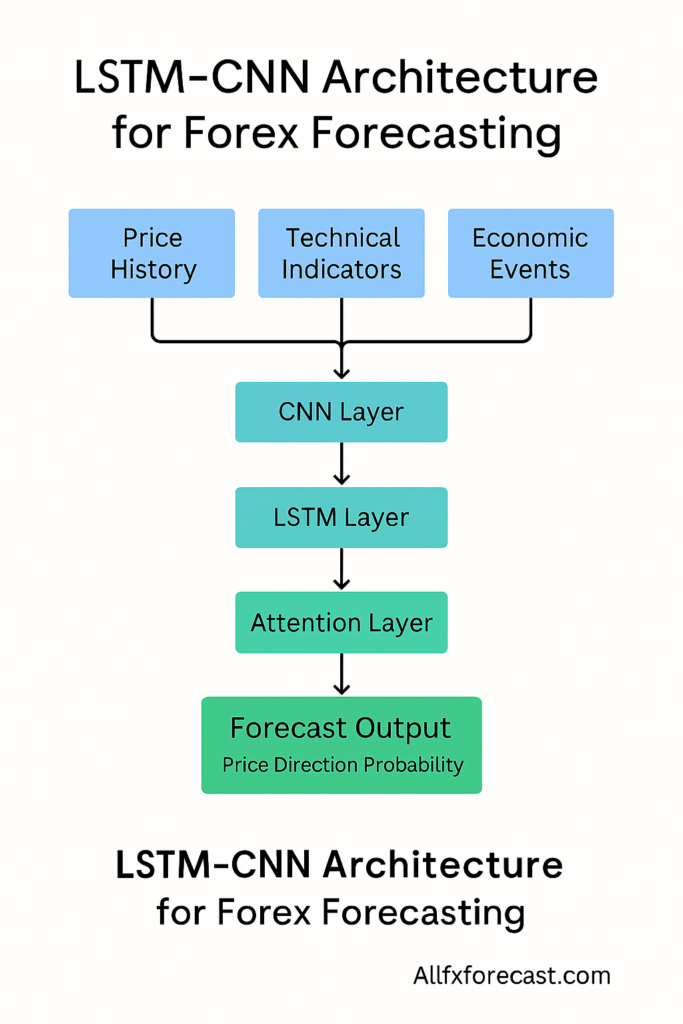
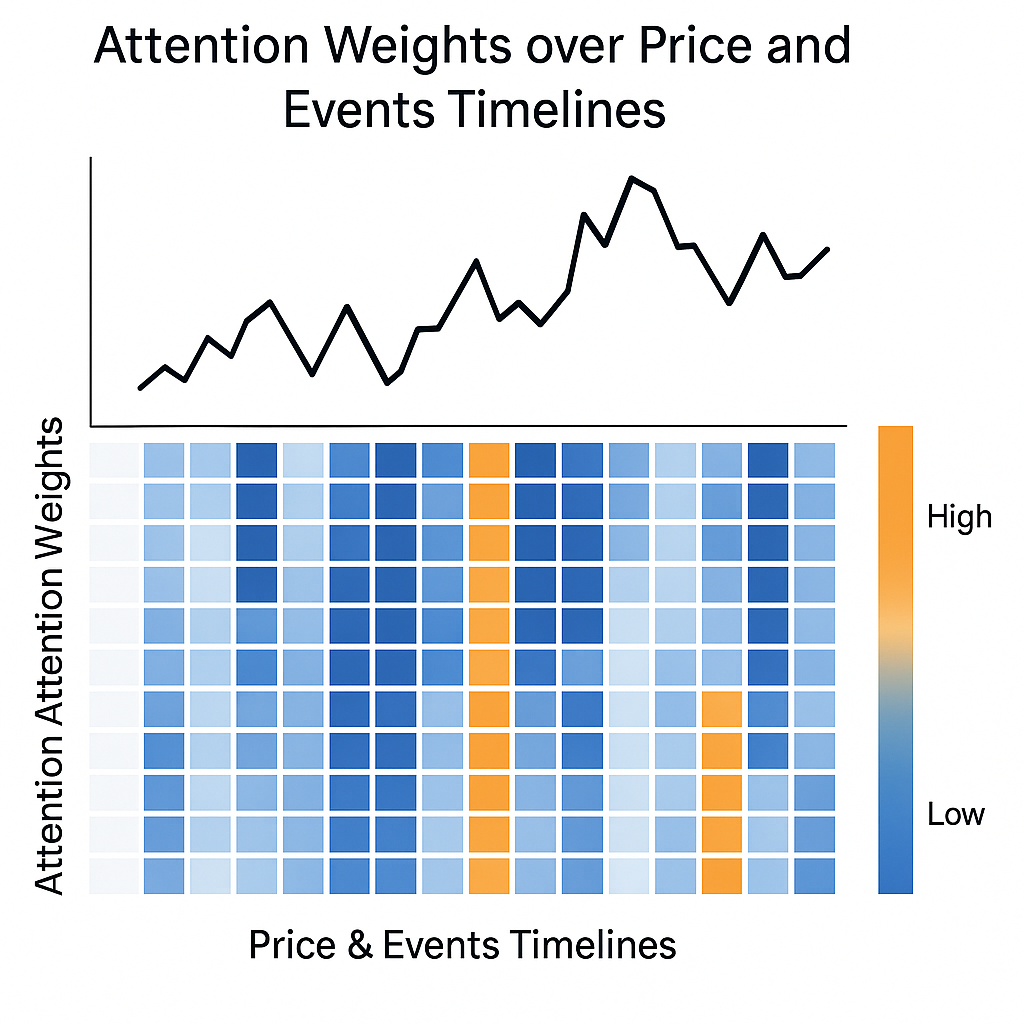
How Can Attention Mechanisms Improve Event‑Driven LSTM Forecasts?
Attention layers focus the model on time steps around economic events. An event‑driven LSTM for GBP/USD reduced forecast error by 15% compared to a vanilla LSTM.
What Best Practices Ensure Robust Risk Management in Forex Forecasts?
Effective forecasting requires strict risk controls and confirmation rules.
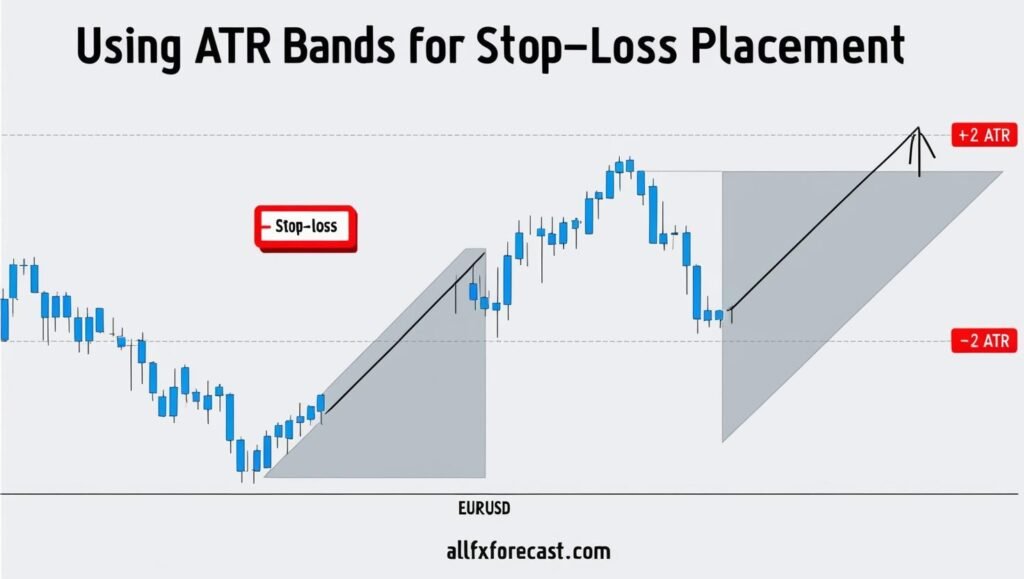
How Should Traders Use ATR‑Based Stops to Balance Noise and Risk?
Using a 2× ATR stop filters out noise while capping risk. For example, with a 50‑pip ATR on EUR/USD, a 100‑pip stop prevents premature exits yet limits losses.
Why Is Multi‑Method Confirmation Vital to Avoid False Breakouts?
Combining at least two signals such as a chart pattern and a volume‑profile high‑volume node reduces false breakouts by roughly 30%, according to backtests.
Frequently Asked Questions
Q1: What is the most reliable chart pattern for forecasting?
While reliability varies, head‑and‑shoulders and harmonic patterns like Gartley often yield 60–70% hit rates when validated across timeframes.
Q2: Can Volume Profile replace standard support and resistance?
Volume Profile complements classic zones by showing where institutional interest lies, often confirming or refining traditional levels.
Q3: Are AI‑based models worth using for technical forecasts?
Yes models like LSTM‑CNN with attention deliver measurable accuracy gains, especially around key events, but require robust data and validation.
Q4: How do I know which stop‑loss method to use?
ATR‑based stops adapt to current volatility, offering a data‑driven approach superior to fixed pip distances.
Conclusion & Next Steps
Bringing together advanced chart patterns, dynamic support and resistance zones, moving‑average crossovers, harmonic and Fibonacci tools, Volume Profile and order‑flow insights, probabilistic indicators, and cutting‑edge AI models creates a truly multi‑layered approach to forex forecasting. By measuring pattern dimensions, validating signals on higher timeframes, aligning with economic events, and applying robust risk controls such as ATR‑based stops and multi‑method confirmation traders gain both precision and confidence in their price projections.
To put these methods into practice, start by focusing on one major currency pair at a time. Use the Interactive Forecast Simulator to draw and test patterns, the Economic Calendar to time entries around key events, and the Correlation Matrix to manage portfolio risk across multiple pairs. Regularly backtest your favorite setups, refine your parameter choices, and maintain disciplined position sizing. With these advanced tools and protocols, you’ll transform technical analysis from a descriptive tool into a predictive engine empowering you to forecast major forex moves with clarity and consistency