Discover proven techniques to identify key price zones, validate levels with advanced tools, and apply them across EUR/USD, GBP/JPY, USD/CHF, and beyond for precise forex predictions.
Key Takeaways
- View support and resistance as zones, not lines, for better accuracy.
- Combine horizontal levels, trend lines, Fibonacci retracements, pivot points, and supply/demand zones.
- Use a multi‑timeframe top‑down approach (weekly → daily → intraday) for high‑confidence zones.
- Confirm levels with volume spikes, candlestick patterns (hammers, engulfing), and indicators (RSI, Stochastic).
- Manage risk by sizing with ATR and limiting risk to 1–2% per trade.
- Apply strategies with clear entry signals, stops, and profit targets (bounce, breakout, channel, Fibonacci confluence).
- Reference real case studies on EUR/USD, GBP/JPY, and USD/CHF to illustrate forecasting in action.
What Are Support and Resistance and How to Use Them to Forecast Forex Pairs Precisely
Introduction
Support and resistance are fundamental concepts in forex trading and forecasting.
Support is a price level or zone where buying interest is strong enough to stop a decline and cause price to bounce upward. Traders look for multiple touches of this area as confirmation of its strength.
Resistance is a price level or zone where selling pressure prevents price from rising further and may trigger a reversal downward. Frequent tests of this zone strengthen its validity.
These levels help you identify precise entry points, stop losses, and profit targets when forecasting pairs like EUR/USD, GBP/JPY, and USD/CHF.
1. What Are Support and Resistance Zones?
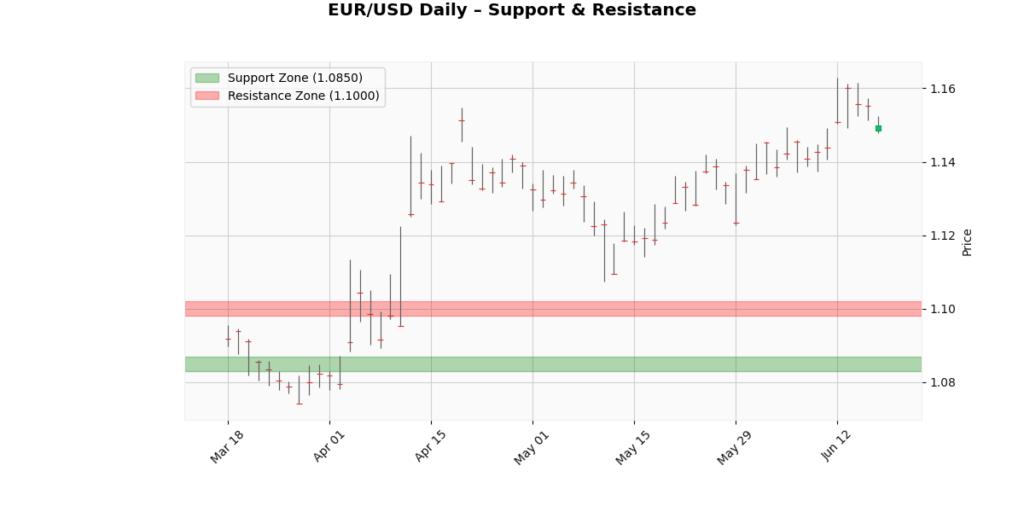
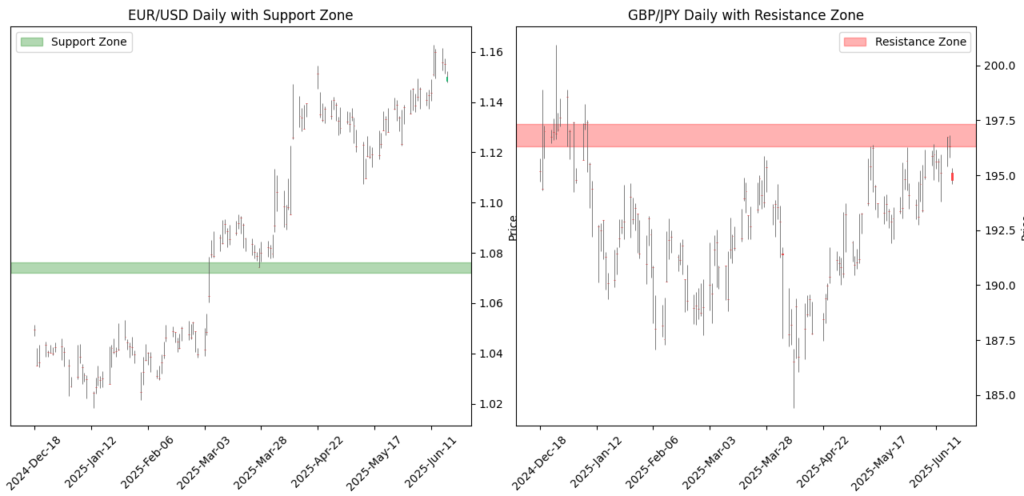
Support is a price zone where buying interest grows strong enough to stop a decline. For example, EUR/USD often finds support around 1.0850 as buyers see value at that level. Resistance is the opposite a zone where selling pressure builds and halts a rise. GBP/JPY tends to stall near 151.50, a level where traders take profits or enter shorts.
2. Why Use Zones Instead of Lines?
Instead of drawing narrow lines at exact highs or lows, mark wider zones usually 20 to 30 pips wide. Price rarely stops at an exact number. Wider zones capture more touches and better reflect real market behavior.
3. How Do We Identify Zones with Advanced Techniques?
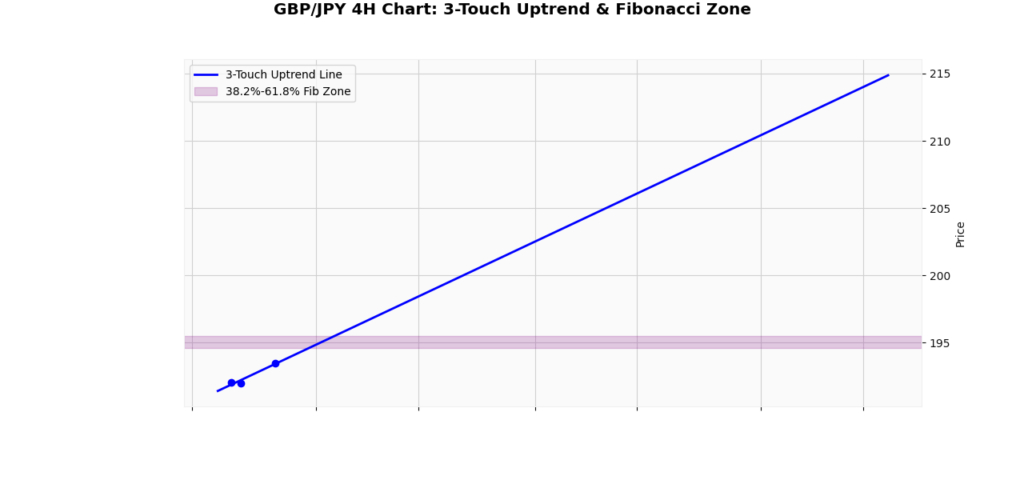
Advanced traders use multiple tools to find zones. Horizontal zones come from clusters of swing points. Trend lines and price channels show dynamic zones when connecting two or more highs or lows; at least three touches confirm validity. Moving averages, such as the 50, 100, and 200 simple and exponential averages, serve as dynamic support or resistance. Fibonacci retracements at 38.2, 50, and 61.8 percent often align with these zones. Pivot points, including daily or weekly standard pivots and Camarilla levels, give intraday reference points. Standard pivot is calculated by adding high, low, and close, then dividing by three. From that, Resistance 1 equals twice the pivot minus the low, and Support 1 equals twice the pivot minus the high. Camarilla R4 and S4 use 1.1 times the range divided by two, added to or subtracted from the close.
4. How Can Multi‑Timeframe Analysis Improve Forecasting?
The top-down approach starts with weekly charts to locate major support and resistance zones. Next, refine those zones on daily charts to see context. Finally, switch to 4-hour or 1-hour charts to time entries and exits precisely. Zones that line up across all three timeframes form high-confidence areas where forecasts are most reliable.
5. What Are Supply and Demand Blocks?
Institutional traders create supply and demand blocks tight ranges before strong moves. Mark these order blocks by identifying the last bearish candle before a bullish run or the last bullish candle before a bearish drop. Using a volume profile helps confirm these zones, since high traded volume often marks genuine institutional interest.
6. Which Strategies Use Support and Resistance?
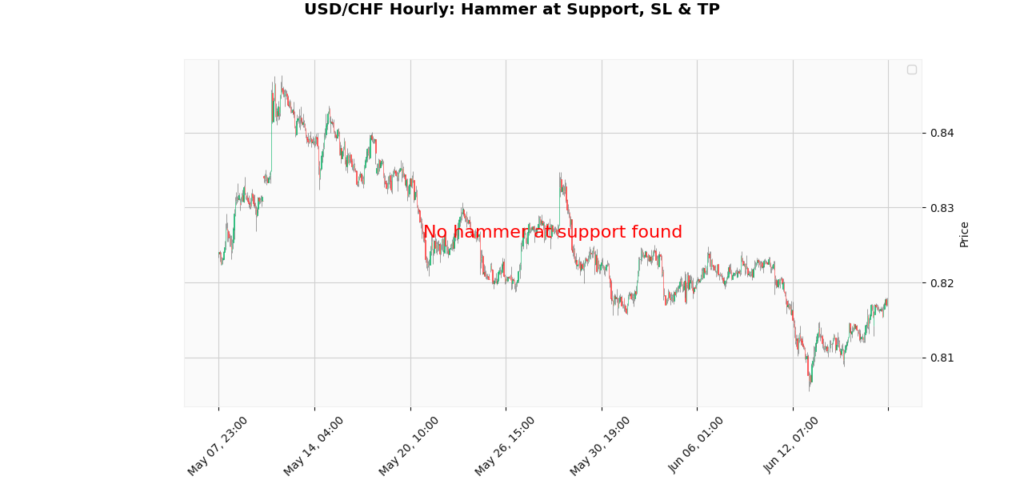
A bounce strategy uses a bullish candlestick, such as a hammer or engulfing candle, inside a support zone. A stop loss sits just below the zone, and the first take profit target is the next resistance or a two-to-one reward-to-risk ratio. For breakout strategies, wait for a candle to close beyond resistance, then let price retest that level. Enter on confirmation and place the stop below the retested zone; use Fibonacci extensions like 1.618 for profit targets. In trending markets, trading within channels means buying at the lower trend line when indicators such as RSI show bullish divergence. Dynamic strategies use rejection at a 61.8% retracement level that overlaps a pivot point, with a stop just beyond the retracement and profit at the extension.
7. How Do We Manage False Breakouts?
To avoid false moves, wait for a pullback to the broken level and look for strong candlesticks like pin bars or engulfing patterns. Confirm the breakout with above‑average volume and larger candle bodies. Consider splitting entry: take half of your position when price first breaks the level and half at the retest to improve risk management.
8. How Does Psychology Affect S/R Flips?
When a broken support turns into resistance (or vice versa), price often overshoots then reverses back. A valid flip needs a clear break beyond the level, a retest candle closing back inside, lower retest volume, and a shift in momentum indicators such as RSI moving from overbought to bearish.
9. How Should We Manage Risk and Ensure Forecast Accuracy?
Define risk per trade using each pair’s ATR so you only risk one to two percent of your account. Exit if price stalls at a level for too long more than three bars to protect capital. Always backtest strategies over historical data and demo trade before using real funds.
10. What Can Case Studies Teach Us About Forecasting?
On June 10, EUR/USD tested weekly resistance in the 1.1000–1.1050 zone that matched the daily 61.8% Fibonacci level. A bearish engulfing formed, and the forecast predicted a drop to the 1.0850 support zone. In April, GBP/JPY found a daily demand block between 149.50 and 150.00 that aligned with the monthly pivot S1. A hammer candle at that level forecasted a rally to 151.50. Intraday, USD/CHF held at its Camarilla S2 level of 0.9000 with a volume spike, leading to a bounce onto the 200‑period EMA at 0.9100.
11. Which Chart Types and Scales Should We Use?
Choose the right chart: candlesticks reveal wicks and bodies for better confirmation than line charts. Heikin-Ashi charts filter noise but lag price use them as a secondary check. Logarithmic scales space percentage moves evenly on larger timeframes; arithmetic scales work for shorter-term analysis.
12. How Can Oscillators and Indicators Confirm Levels?
RSI divergence at support or resistance helps confirm bounces or reversals. The stochastic oscillator shows oversold or overbought conditions at key levels. Bollinger Bands often align with S/R zones, indicating volatility squeezes or expansions.
13. How Can Algorithmic Tools Detect Zones?
Systematic traders use tools like Keltner Channels ATR bands around an EMA and Donchian Channels, which track recent highs and lows automatically, defining dynamic support and resistance zones to guide algorithmic entries and exits.
14. How Do Session Highs/Lows and VWAP Act as Levels?
Intraday traders watch session highs and lows from London, New York, and Asian sessions as natural support and resistance. The VWAP, a volume‑weighted average, often acts as dynamic support in an uptrend and as resistance in a downtrend.
15. Which Chart Patterns Serve as Support and Resistance?
Classic patterns also create key levels. In a head and shoulders, the neckline becomes a pivot where support may flip to resistance. Double tops and bottoms center lines between peaks or troughs into zones to watch. Triangles form trendlines on the pattern’s edges, serving as dynamic support and resistance until a breakout sets new levels.
16. How Do We Measure Level Strength and Validity?
Zones gain strength when touched three or more times, especially on higher timeframes. High volume at a level shows institutional interest. Longer durations of formation such as daily zones add credibility. Always measure these metrics when forecasting.
17. How Do Levels Differ in Trending vs. Ranging Markets?
In trending markets, wait for pullbacks to dynamic levels like moving averages or trend lines and trade in the trend direction. In ranging markets, buy at support and sell at resistance within horizontal zones, using clear boundaries defined by prior lows and highs.
18. How Can We Backtest Support and Resistance Effectively?
Overlay historical S/R zones onto current charts to test how often price reacts. Use quantitative filters to measure average bounce sizes, failure rates, and false-break percentages over sample periods, ensuring statistical support for your forecasts.
19. What Are Liquidity Pools and Stop Hunts?
Large traders trigger sharp reversals by hunting clustered stop orders beyond common S/R zones. Identify these liquidity pools areas of pending orders above resistance or below support to anticipate potential spikes and reversals.
20. What Are Smart Money and Price Action Concepts?
Order blocks mark the last bearish candle before a bullish run or the last bullish before a bearish move, capturing institutional footprints. Fair value gaps, where two candles leave price inefficiencies, often pull price back. Market structure breaks, such as invalidating higher highs or lower lows, turn old levels into new support or resistance. Add 1–2 pips of padding to S/R zones to account for stops and spread.
21. How Do Fundamentals Impact Support and Resistance?
Major economic releases like nonfarm payrolls or CPI often break key levels. Central bank rate decisions can flip old resistance into new support. Always mark upcoming news zones on your charts to adjust forecasts accordingly.
22. How Do Cross-Pair Correlations Strengthen Forecasts?
Support and resistance levels often line up across correlated currency pairs. For example, if EUR/USD is nearing support and USD/CHF its negatively correlated pair is testing resistance, the forecast becomes more reliable. Use correlation matrices and cross-pair chart comparisons to find shared timing zones. If GBP/USD and EUR/USD both bounce at similar zones, that correlation confirms broader market pressure or sentiment.
23. How Can We Use Alternative Charts Like Renko?
Renko charts remove time and focus on price movement only. This makes them powerful for spotting horizontal support and resistance. When bricks stack and reverse at the same level multiple times, those areas become high-confidence zones. Use Renko charts alongside candlesticks to validate breakout or bounce setups, especially in trending markets.
24. What Role Does Trader Sentiment and COT Data Play?
The Commitment of Traders (COT) report shows how large institutions and commercial traders are positioned. If a major pair nears resistance while institutional short positions are rising, that zone becomes stronger. Retail sentiment from brokers like IG or FXCM can also be helpful when most retail traders are long near resistance, that’s often a contrarian signal. Use these sentiment tools to confirm or question support/resistance setups.
25. How Can We Forecast Volatility Zones Around News Events?
Major news events like NFP, CPI, or central bank rate decisions can break strong support/resistance zones. Use economic calendars to highlight pre-event “volatility zones.” Options pricing around events shows where traders expect big moves often bracketing price inside key zones. Mark these expected range highs/lows and monitor for breakouts.
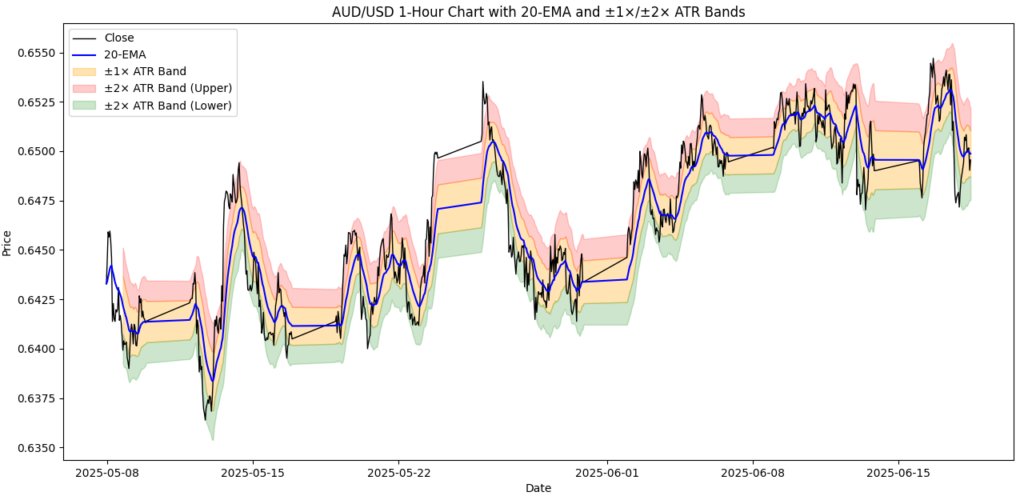
26. How Do We Use ATR-Based Bands for Adaptive S/R?
Besides sizing trades, ATR can build dynamic support and resistance. Plot ±1× and ±2× ATR bands around a moving average (like the 20-EMA). When price hits these bands repeatedly, they create flexible support/resistance that adapts to current volatility. These zones can serve as dynamic entries, stops, or targets depending on trend direction.
Conclusion
Support and resistance zones form the foundation of accurate forex forecasting for currency pairs like EUR/USD, GBP/JPY, and USD/CHF. By combining clear zone identification, multi‑timeframe analysis, advanced tools such as Fibonacci and order blocks, and strong risk controls plus these new insights on pair correlations, alternative chart types, institutional and sentiment data, event‑driven volatility, and dynamic ATR bands you now have the most comprehensive, actionable roadmap to set precise entry, stop‑loss, and profit targets across any currency pair.