Trend lines help you see the market’s direction and predict future price moves. By drawing valid lines, confirming signals with indicators, and testing across timeframes, you can fine-tune your forecasts on EUR/USD, USD/JPY, AUD/USD, and other pairs.
Key Takeaways
- Trend lines connect two or more swing points to define market direction.
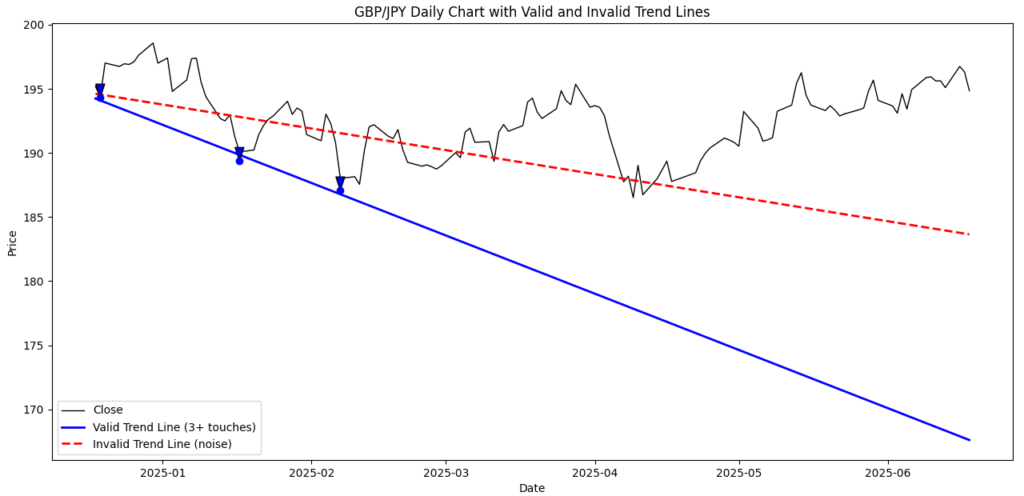
- Confirm validity with at least three touches and even spacing.
- Use rising, falling, and horizontal channels for dynamic zones.
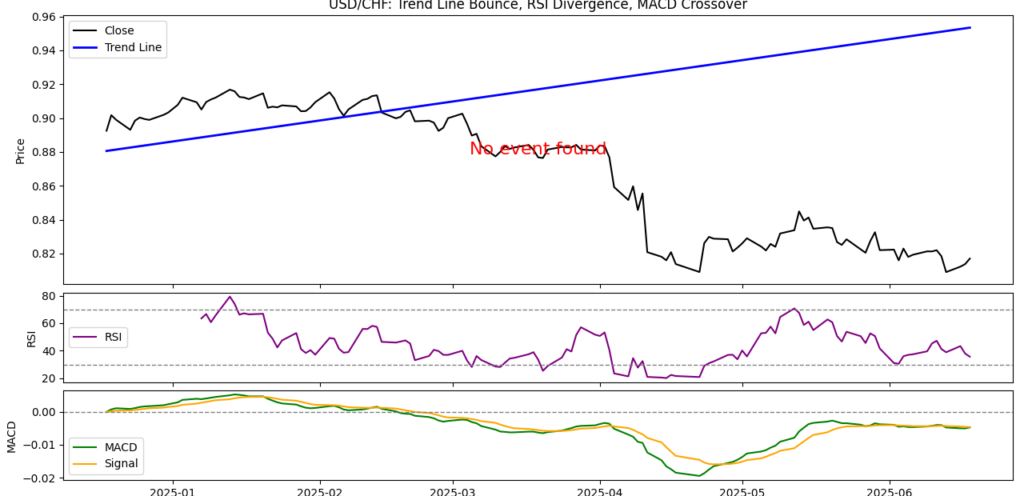
- Combine trend lines with indicators (RSI divergence) and price action for stronger signals.
- Manage false breaks by waiting for retests and volume confirmation.
- Apply trend line forecasts to set entries, stops, and targets on multiple timeframes.
What Are Trend Lines and How to Use Them for Accurate Forex (FX) Pair Forecasts?
Learn how to draw, confirm, and forecast with trend lines on pairs like EUR/USD, USD/JPY, and AUD/USD to improve your forex predictions.
Trend lines help you forecast forex pairs like EUR/USD, USD/JPY, and AUD/CHF with more accuracy. When drawn properly, confirmed by indicators, and tested over time, they give reliable entry and exit zones. Add these to your forecasting system to trade with better timing and confidence.
1. What Is a Trend Line in Forex Forecasting?
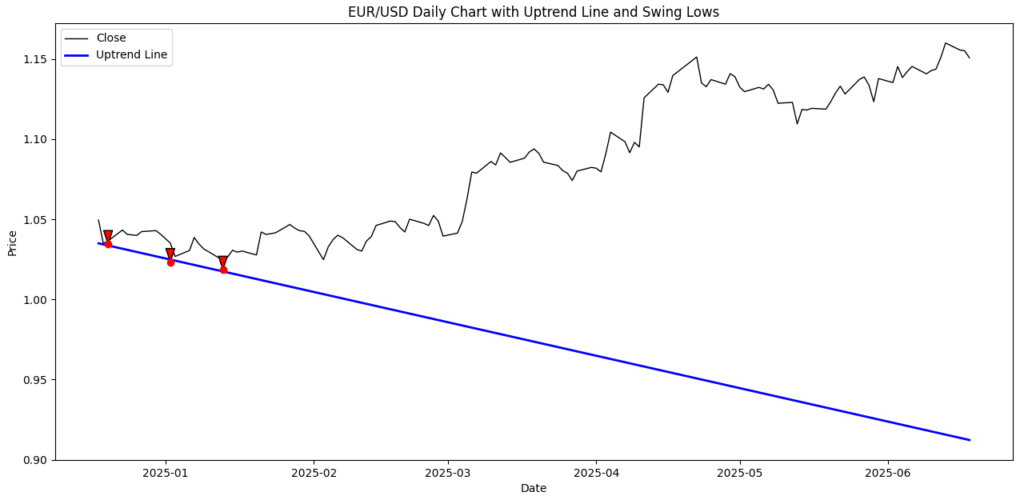
A trend line is a straight line connecting swing lows in an uptrend or swing highs in a downtrend. It shows where price is likely to continue or reverse. Trend lines help traders forecast price moves by identifying zones where the market may bounce or break. They are key to making solid forex predictions across pairs.
2. Why Are Trend Lines Important for Predicting Forex Moves?
Trend lines show traders the market’s current bias. A rising line supports higher prices. A falling line limits rallies. When the price touches a trend line and reacts, it signals potential trades. This helps forecast future price zones on pairs like GBP/USD or AUD/JPY.
3. How Do You Draw and Validate Reliable Trend Lines?
- Use line or candle close prices to reduce wick noise.
- Pick clean, extreme highs or lows as anchor points.
- Look for three or more touches with some space between them.
- Avoid drawing through random peaks. Only use swings that stand out.
- Good slopes are around 30 to 45 degrees. Very steep lines break fast.
- Extend the line forward to predict future moves.
- Measure slope: check how many pips per bar the trend is rising or falling.
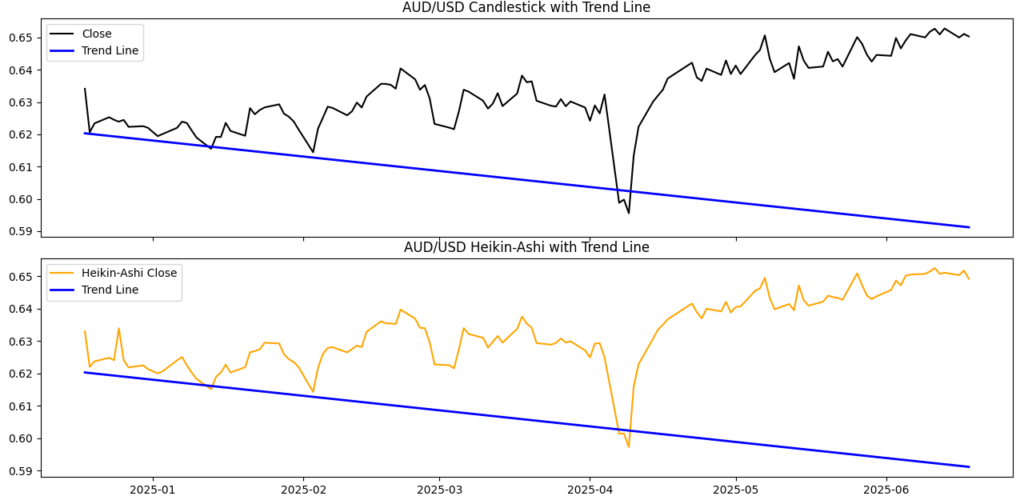
- Compare lines on candlestick, Heikin-Ashi, and Renko charts.
- You can also use a 50-period moving average as a dynamic trend line.
4. How Can Channels and Patterns Help Forecast Forex Pairs?
A channel is a pair of parallel lines around a trend. They catch the swing highs and lows. If price bounces between them, you can forecast trades inside the zone. Wedges and flags show tight areas before big breakouts. You can also use regression channels based on math to mark possible support and resistance zones.

5. How Do We Confirm Trend Line Signals?
- RSI Divergence: Look for momentum loss at touch points (e.g., lower highs on RSI in a downtrend) to signal reversals.
- Candlestick Patterns: Hammers, shooting stars, or engulfing patterns at the line strengthen entry signals.
- Volume Spikes: Higher volume at bounces or breaks adds conviction.
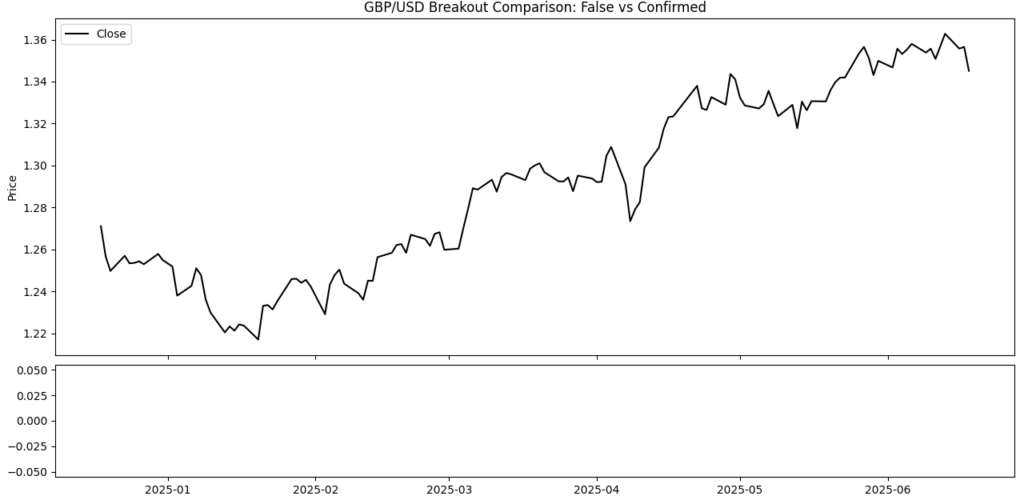
6. How Do You Spot and Avoid False Breakouts?
- Only trust breaks if the candle closes far beyond the line (1–2% or half ATR).
- Wait for a pullback to the line and then a strong bounce before entering.
- Check if ATR grows—false breaks often happen in low-volatility zones.
- Take partial trades: half at the break, half after the retest.
7. What Does Trader Psychology Say About Trend Lines?
When price nears a trend line, many traders react. Some take profits. Others jump in. That’s why big candles and wicks happen there. Reading this behavior helps you make better forecasts.
8. How Should You Use Trend Lines Across Multiple Timeframes?
Start on the weekly chart to find the main trend. Then use the daily chart to see medium-term moves. Use 4H or 1H to enter trades. If all trend lines line up, your forecast is more likely to be correct.
Aligning Weekly and Daily Trends
Overlay weekly trend lines onto daily charts to verify that major support or resistance zones match. When both timeframes share the same slope and level, the zone gains strength.
Intraday Entry Timing
Once weekly and daily lines agree, switch to 4H or 1H charts. Look for consolidation or pullbacks to the intraday trend line for precise entry points.
Avoiding Mixed Signals
If weekly and daily trend lines give conflicting directions, never force trades. Wait for clear alignment to maintain forecast accuracy.
Start on the weekly chart to find the main trend. Then use the daily chart to see medium-term moves. Use 4H or 1H to enter trades. If all trend lines line up, your forecast is more likely to be correct.
9. How Can Order Flow and Sentiment Help with Trend Lines?
Use tools that show how big traders act at trend lines. If volume grows and order flow shifts, your line matters. Sentiment data shows if too many retail traders are on one side. This helps you forecast reversals.
10. What Are Trend Line Breakout Strategies?
- Use the size of the channel to set your target (measured move).
- If price breaks and fails to retest, it may reverse fast (swing failure).
- A break that matches pivot levels is more reliable.
11. How Do You Set Risk and Targets with Trend Lines?
Place stops beyond the trend line by 1–2× ATR. Targets can be the top or bottom of the channel, last swing level, or the breakout projection.
12. What Do Real Examples Show About Trend Lines?
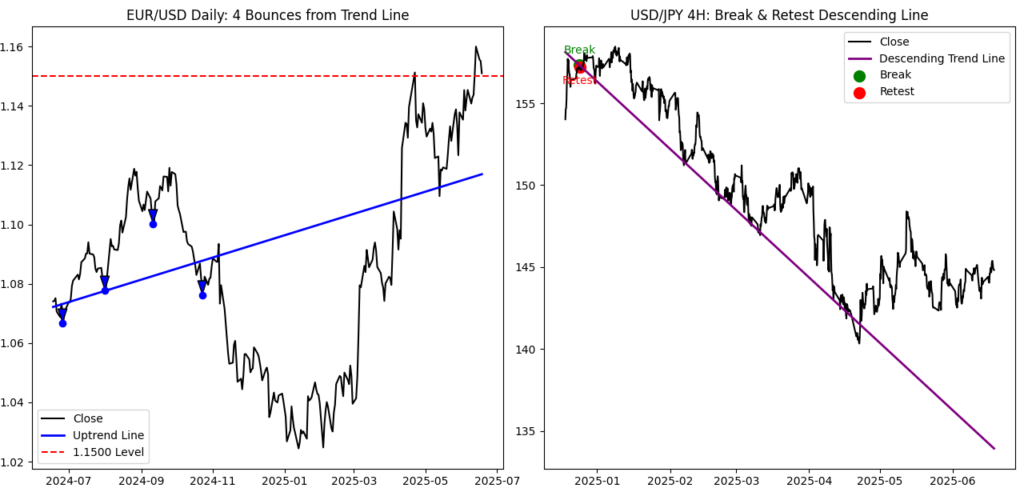
- EUR/USD rose from a rising trend line four times before hitting 1.1500.
- USD/JPY broke a falling 4H line, pulled back, then dropped to 146.00.
These examples show how well-placed lines forecast price in real trades.
13. What Do Log and Renko Charts Add to Trend Lines?
Use a log scale for long-term charts. It evens out percent moves. Use Renko charts to remove noise. Draw trend lines on bricks and then map them to candles. This gives cleaner zones.
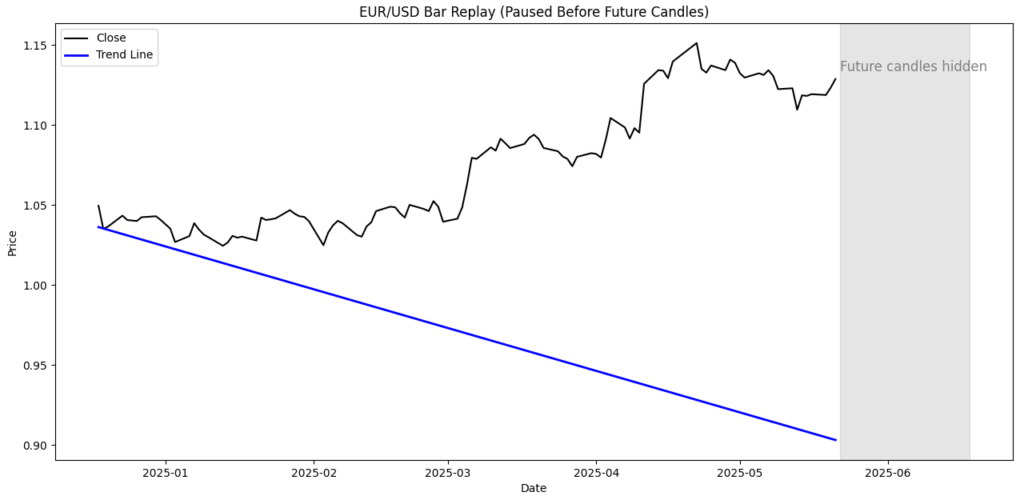
14. How Can You Backtest Trend Line Forecasts?
- Use bar replay to draw trend lines step by step.
- Draw lines on half the chart, then test on the other half.
- Track how many touches the line gets and how far price moves.
- Build a score: include touch count, volume, time gap, and reaction size.
15. How Do Trend Lines Work with Other Tools?
When trend lines match Fibonacci levels, pivot points, or supply/demand zones, the level gets stronger. Using multiple tools makes your forecast more accurate.
Conclusion
Trend lines help you forecast forex pairs like EUR/USD, USD/JPY, and AUD/CHF with more accuracy. When drawn properly, confirmed by indicators, and tested over time, they give reliable entry and exit zones. Add these to your forecasting system to trade with better timing and confidence.