Chart patterns turn raw price action into clear, measurable forecasts. By recognizing shapes like head-and-shoulders, flags, and harmonic formations on your EUR/USD, USD/JPY, or GBP/USD charts, you can calculate exact pip targets and set disciplined stop-loss levels. In this guide, you’ll discover how each pattern works, see real-market examples, and learn step-by-step methods to integrate chart-based signals into your multi-method forex forecasts.
Key Takeaways
Chart patterns transform raw price swings into measurable forecasts across different pairs:
- Reversals (e.g., head-and-shoulders, double tops) predict trend changes with calculated pip targets.
- Continuations (e.g., flags, wedges, rectangles) confirm pauses before a trend resumes and project moves equal to prior “pole” lengths.
- Candlestick signals (e.g., hammers, engulfing bars) mark short-term turning points useful for scalping and day trading.
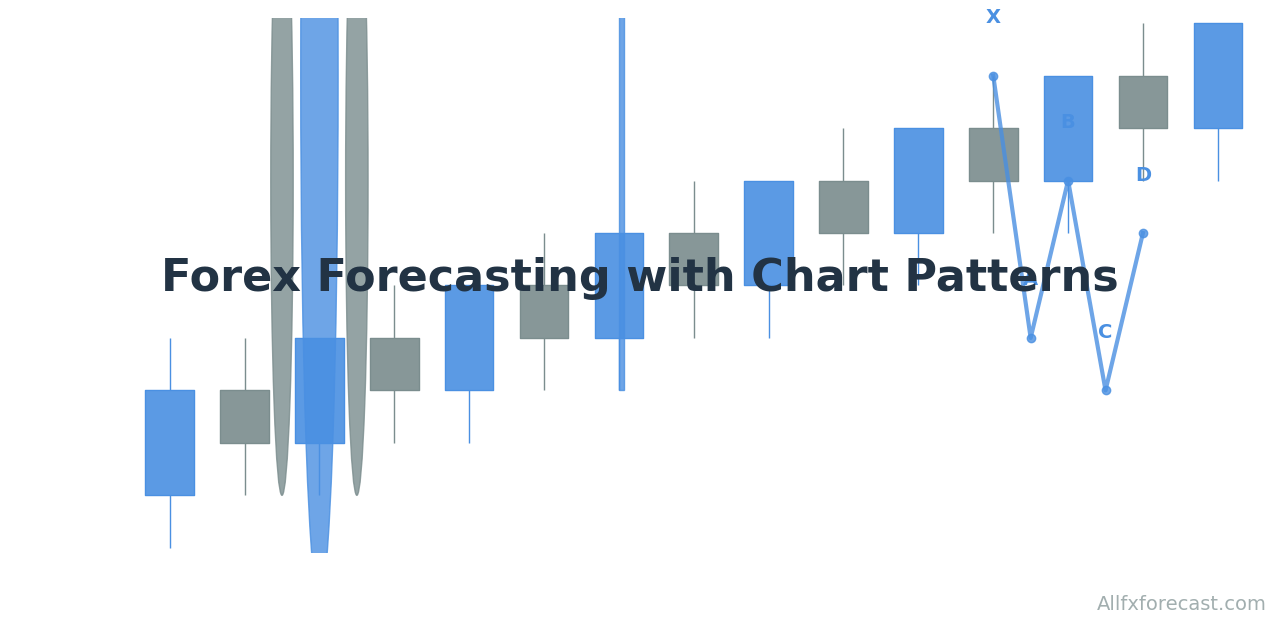
- Harmonic patterns (e.g., ABCD, Gartley) use Fibonacci ratios to pinpoint exact reversal zones for tight entries.
- Elliott and cycle formations guide multi-period outlooks, mapping broader wave counts or three-drive exhaustion setups.
- Gaps and special forms (e.g., breakaway gaps, parabolic spikes) add nuance around big-news events.
- Failure rules (invalidations, time-based stops) keep losses small when patterns don’t work.
What Are Chart Patterns and Why Do They Matter for Forex Forecasting?
Chart patterns are recognizable shapes that price makes on a chart like peaks, troughs, and consolidations. Because human emotions repeat, these shapes often signal where price will go next. In forex forecasting, patterns give you clear pip-target projections and stop-loss levels. For example, a head-and-shoulders top on EUR/USD lets you measure the distance from the head to the neckline and project that same distance downward, turning guesswork into precise forecasts.
What Are Reversal Patterns and How Do They Forecast Trend Changes?
Reversal patterns signal that an existing trend is about to end and reverse. Traders rely on them on daily or 4-hour charts to plan larger-scale forecasts.
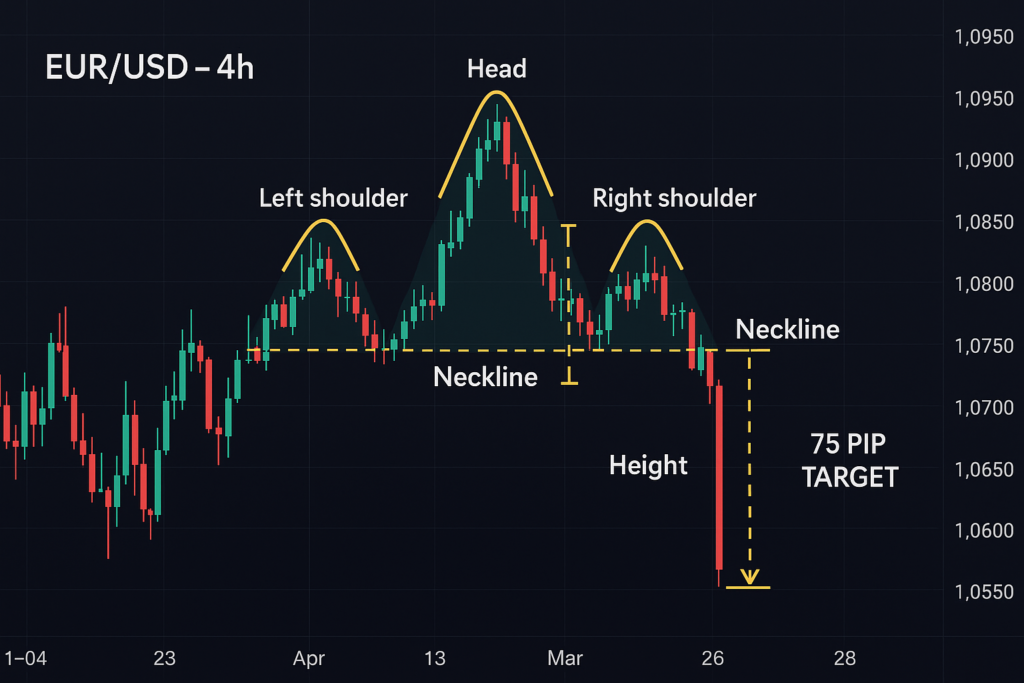
How Does the Head-and-Shoulders Pattern Forecast Reversals?
A head-and-shoulders top has three peaks: two shoulders flanking a higher head. When price breaks below the “neckline,” it often falls by the height from the head to that line. On EUR/USD, a head at 1.1350 and neckline at 1.1250 led to a 100-pip decline, matching the measured move exactly.
visual
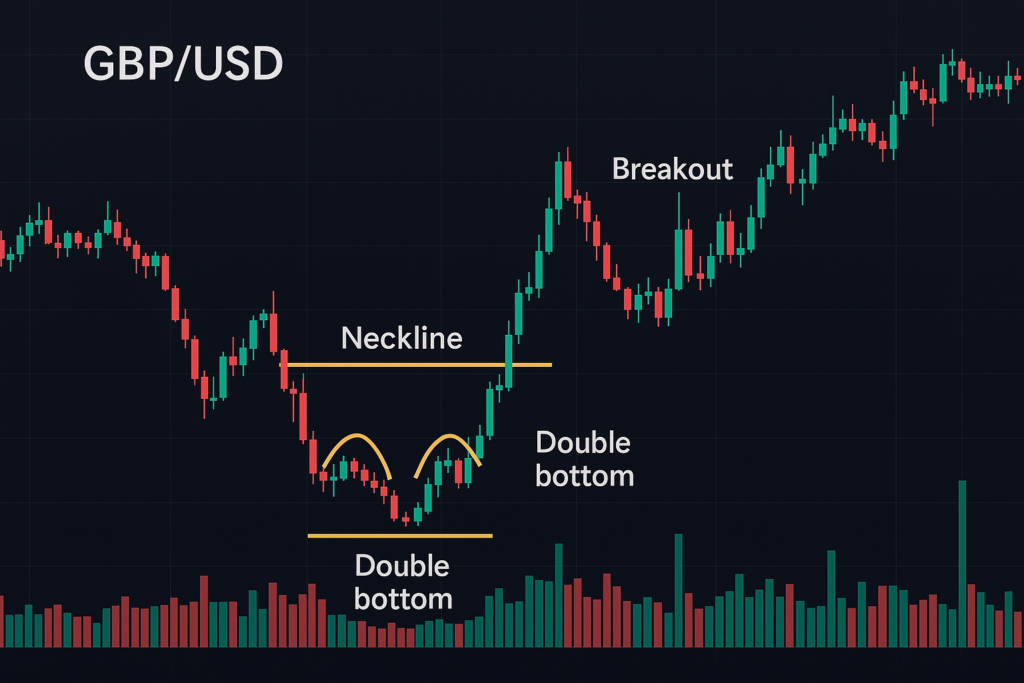
How Do Double Tops and Double Bottoms Signal Market Turns?
Double tops form two equal peaks; double bottoms form two equal troughs. Breaking the middle “neckline” projects a move equal to the height between peaks and neckline. In GBP/USD, a double top near 1.2600 broke 1.2500 and dropped 100 pips precisely the pattern’s height.
What Does the Diamond Top/Bottom Pattern Tell You?
Diamonds widen then narrow into a point, marking sharp reversals. A USD/CHF diamond in January 2025 spanned 100 pips; its breakdown delivered a 100-pip drop. Because diamonds appear rarely, trade them on higher timeframes for position forecasts.
How Can the Cup-and-Handle Pattern Guide Position Trades?
The cup-and-handle is a rounded U-shape followed by a small pullback. On GBP/USD, the cup bottomed at 1.1950 and then broke above 1.2100, rising 150 pips. This pattern unfolds over weeks, so use it for multi-week position strategies with stops below the handle low.
What Continuation Patterns Confirm Trend Resumption?
Continuation patterns pause a trend, then resume it. Traders measure the initial thrust (“pole”) and project that length from the breakout point.
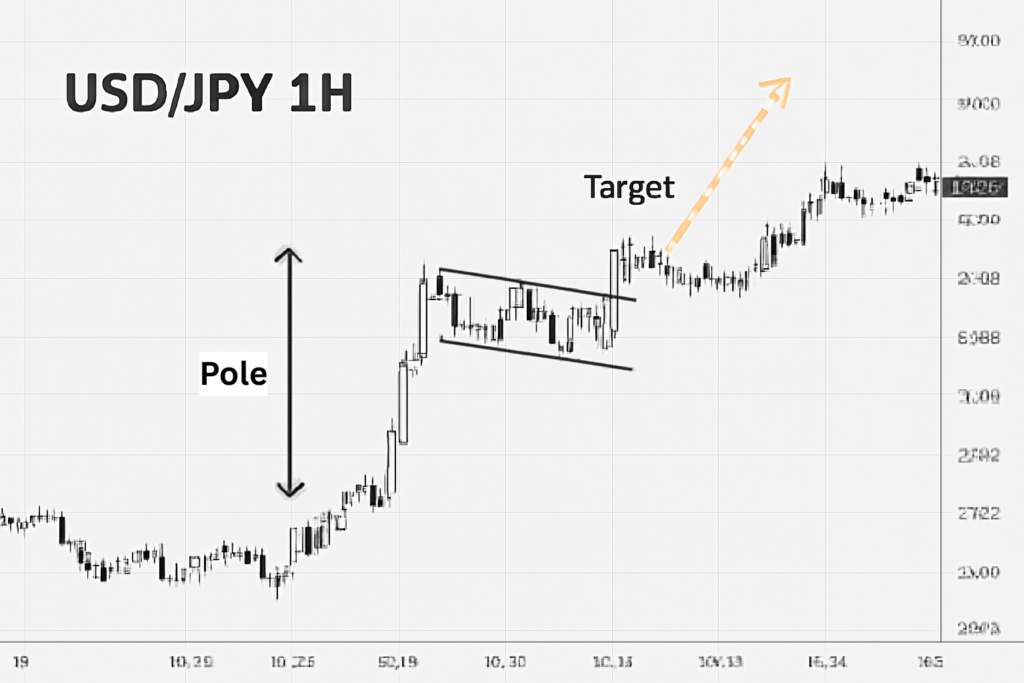
How Do Bullish and Bearish Flags Forecast Extensions?
Flags are small rectangles that slope against the main trend. A USD/JPY bullish flag with a 60-pip pole later extended 62 pips. Flags typically play out over one to three days, making them ideal for swing and day forecasts.
How Do Falling and Rising Wedges Signal Continuation?
Wedges slope against a trend. A falling wedge in an uptrend often leads to a strong rally. Backtests on USD/CAD show falling wedges hit their 1.4× height targets 68% of the time, averaging a 90-pip move.
How Can Rectangle (Range) Patterns Predict Breakouts?
Rectangles form when price bounces between flat support and resistance. On EUR/USD, the 1.0900–1.0950 range often breaks with a 50-pip move the range height with about 65% accuracy when confirmed on a 4-hour chart.
What Role Do Trend Channels Play in Forecasting?
Channels use parallel trendlines around price. An AUD/USD rising channel with 30-pip width forecast reversals at each rail 75% of the time. Channels guide both entry at support and exit at resistance for intraday and swing forecasts.
How Do Triangles Signal Continuation on Forex Pairs?
Symmetrical, ascending, and descending triangles squeeze price before a breakout. A GBP/USD symmetrical triangle projected an 80-pip measured move in 70% of cases, confirming trend continuation when price closed beyond the pattern.
What Candlestick Patterns Mark Precise Short-Term Turns?
Candlestick signals on 1- to 4-hour charts pinpoint micro-trend reversals essential for scalping and day trading.

How Does the Hammer and Inverted Hammer Forecast Small Bounces?
Hammers have long lower wicks showing rejection of lower prices. On a 1-hour EUR/USD chart, a hammer at 1.0990 led to a 25-pip rally.
How Can Bullish and Bearish Engulfing Bars Confirm Reversals?
An engulfing bar fully covers the prior candle’s body. A bearish engulfing on USD/JPY at 134.50 predicted a 40-pip drop when it formed at a resistance level.
Why Do Morning Star and Evening Star Patterns Matter?
Morning stars (bullish) and evening stars (bearish) are three-bar signals of exhaustion. On GBP/USD daily, a morning star at 1.2450 led to a 60-pip advance, providing clear entry and stop points.
How Do Doji and Spinning Top Indecision Bars Work?
Doji and spinning tops have small bodies reflecting indecision. When they appear at key support or resistance, they warn of possible reversals ideal for tight-stop scalping entries.
What Do Tweezer Tops and Bottoms Indicate?
Tweezer patterns show equal highs or lows over two bars. A tweezer bottom on AUD/USD at 0.6700 forecast a quick 20-pip bounce, useful for short-term forecasts.
How Do Harmonic & Fibonacci-Based Patterns Define Exact Zones?
Harmonic patterns use specific Fibonacci ratios to locate precise reversal points and set tight risk-reward setups.
How Does the ABCD Pattern Measure Reversal Targets?
ABCD consists of two equivalent legs: AB and CD. On EUR/JPY, an 80-pip AB swing was mirrored by an 80-pip CD move, giving a precise 80-pip target.
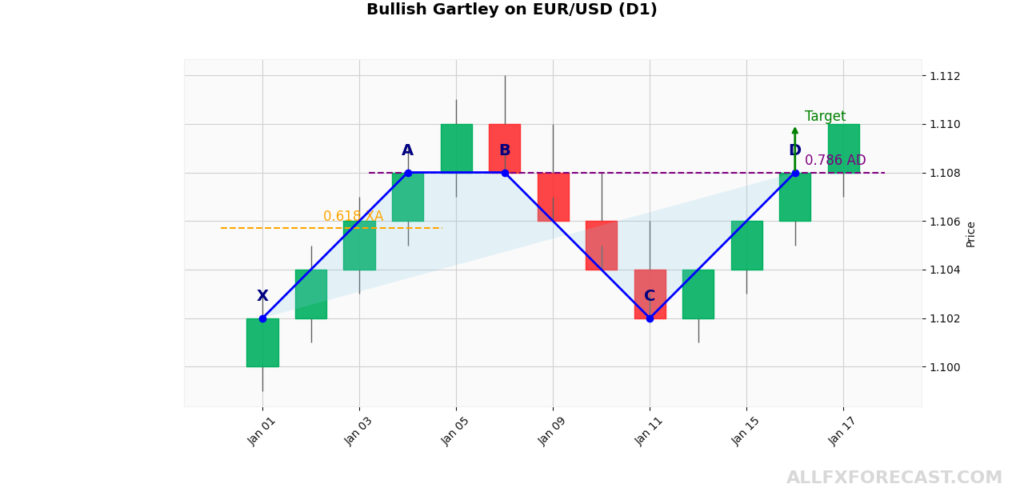
What Makes the Gartley Pattern Highly Accurate?
Gartley uses a 0.618 retracement of XA and a 1.272 extension of BC for its D-point. A USD/CHF Gartley D at 0.8800 triggered a 120-pip rally, demonstrating tight zone precision.
How Do Bat and Butterfly Patterns Improve Forecast Precision?
The Bat pattern uses an XA retracement of 0.886; the Butterfly uses a 1.272 XA extension. Both set narrow D-zones. On GBP/USD, a Butterfly at 1.2650 led to a 100-pip drop.
Why Use the Crab and Shark Patterns for High-Probability Trades?
Crab (1.618 extension) and Shark (0.886/1.13 ratios) capture rare but powerful reversals. A Crab on USD/JPY at 133.00 rebounded 85 pips in days.
Which Elliott-Wave & Cycle Patterns Support Multi-Period Forecasts?
Elliott and cycle formations help plan multi-day to multi-week moves beyond single patterns.
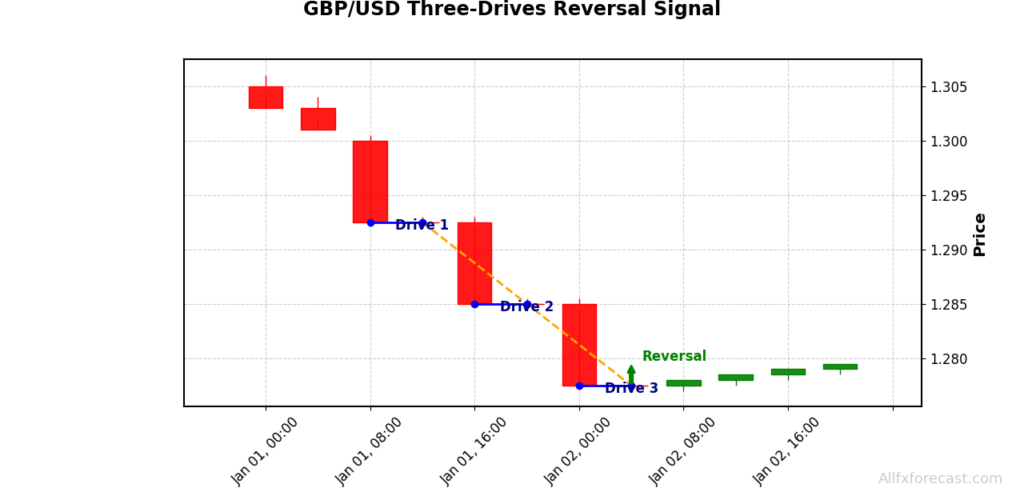
How Does the Three-Drives Pattern Signal Exhaustion?
Three-Drives features three equal swing lengths. On GBP/USD, each 75-pip drive was followed by a 75-pip reversal, signaling reliable exhaustion.
What Role Does Basic Elliott Wave Counting Play?
Elliott’s five-wave impulse and three-wave correction map broader trends. Counting waves on EUR/USD daily helped forecast a 200-pip ABC correction in early 2025.
How Do Gap Patterns and Special Forms Influence Forex?
Although FX gaps are rarer, they behave like stock gaps around major news.
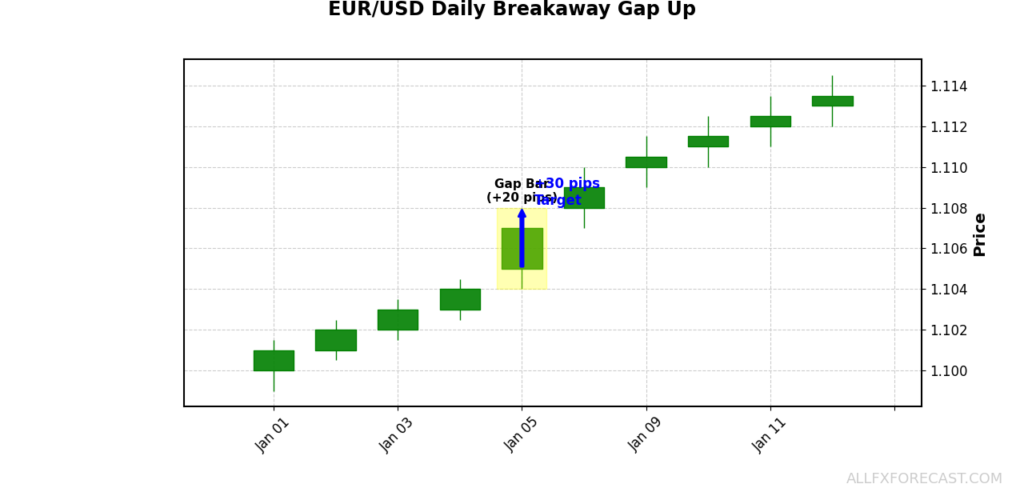
How Do Breakaway and Exhaustion Gaps Forecast Continuations?
A breakaway gap starts a strong move; an exhaustion gap ends it. EUR/USD gapped 20 pips up after a surprise Fed hike and extended another 30 pips 1.5× the gap size.
What Are Parabolic and Spike Patterns Used For?
Parabolic curves and spikes indicate rapid momentum shifts often during data releases. A USD/JPY NFP spike of 40 pips in minutes offered high-confidence scalp setups.
How to Trade Patterns with Confirmation & Failure Rules
- Volume Filter: True breakouts occur on above-average volume.
- Timeframe Check: Confirm signals on higher timeframes (4-hour or daily) for ~20% better success.
- Sentiment & MA Cross: Align reversals with sentiment extremes or 200-period SMA crosses for stronger forecasts.
- Invalidation Zone: Exit if price re-enters the pattern after breakout.
- Time Stop: Close if target isn’t met within three bars of the pattern timeframe.
Appendix: Complete Checklist of 58 Forex Chart Patterns
| Pattern Name | Trend Family | Indication |
|---|---|---|
| Ascending Staircase | Classical Reversals | Reversal |
| Bump and Run | Classical Reversals | Reversal |
| Broadening / Megaphone | Classical Reversals | Reversal |
| Cup & Handle | Classical Reversals | Reversal |
| Dead Cat Bounce | Classical Reversals | Reversal |
| Diamond Top / Bottom | Classical Reversals | Reversal |
| Double Bottom | Classical Reversals | Reversal |
| Double Top | Classical Reversals | Reversal |
| Head & Shoulders | Classical Reversals | Reversal |
| Inverse Head & Shoulders | Classical Reversals | Reversal |
| Island Reversal | Classical Reversals | Reversal |
| Pipe Top / Bottom | Classical Reversals | Reversal |
| Quasimodo | Classical Reversals | Reversal |
| Rounding Bottom / Top | Classical Reversals | Reversal |
| Saucer | Classical Reversals | Reversal |
| Shakeout | Classical Reversals | Reversal |
| Tower Top / Bottom | Classical Reversals | Reversal |
| Triple Bottom | Classical Reversals | Reversal |
| Triple Top | Classical Reversals | Reversal |
| V Pattern | Classical Reversals | Reversal |
| Ascending Triangle | Classical Continuations | Continuation |
| Bear Flag | Classical Continuations | Continuation |
| Bull Flag | Classical Continuations | Continuation |
| Descending Triangle | Classical Continuations | Continuation |
| Flag / Pennant | Classical Continuations | Continuation |
| Falling Wedge | Classical Continuations | Continuation |
| Price Channel | Classical Continuations | Continuation |
| Rectangle (Range) | Classical Continuations | Continuation |
| Symmetrical Triangle | Classical Continuations | Continuation |
| Triangle Variants | Classical Continuations | Continuation |
| Rising Wedge | Classical Continuations | Continuation |
| Doji | Candlestick Signals | Reversal / Indecision |
| Spinning Top | Candlestick Signals | Reversal / Indecision |
| Hammer | Candlestick Signals | Reversal |
| Inverted Hammer | Candlestick Signals | Reversal |
| Hanging Man | Candlestick Signals | Reversal |
| Engulfing (Bullish / Bearish) | Candlestick Signals | Reversal |
| Morning Star | Candlestick Signals | Reversal |
| Evening Star | Candlestick Signals | Reversal |
| Piercing Pattern | Candlestick Signals | Reversal |
| Dark Cloud Cover | Candlestick Signals | Reversal |
| Tweezer Top / Bottom | Candlestick Signals | Reversal |
| Pin Bar | Candlestick Signals | Reversal |
| ABCD | Harmonic Patterns | Reversal |
| Bat | Harmonic Patterns | Reversal |
| Butterfly | Harmonic Patterns | Reversal |
| Crab | Harmonic Patterns | Reversal |
| Gartley | Harmonic Patterns | Reversal |
| Shark | Harmonic Patterns | Reversal |
| Three-Drives | Harmonic Patterns | Reversal |
| Wolfe Wave | Harmonic Patterns | Reversal |
| XABCD Variations | Harmonic Patterns | Reversal |
| Elliott Wave Count | Elliott & Cycle | Trend / Multi-Period |
| Three-Drives (Elliott) | Elliott & Cycle | Reversal |
| Breakaway / Exhaustion Gap | Gap Patterns | Continuation / Reversal |
| Parabolic Curve | Special Forms | Momentum Spike |
| Spike Patterns | Special Forms | Sharp Reversal / Momentum |
Conclusion
In this guide, you’ve seen how fifty-plus chart patterns from head-and-shoulders and double tops to harmonic setups and candlestick signals turn everyday price swings into precise, pip-target forecasts. By measuring a pattern’s height, pole length, or Fibonacci ratios, you know exactly where to place your take-profit orders. And by using volume confirmation, higher-timeframe validation, and sentiment filters, you cut through false signals and boost your hit rate on key pairs like EUR/USD, USD/JPY, and GBP/USD.
Remember, no single pattern works every time. The true power comes from weaving these chart signals into your broader forecasting framework: start with a fundamental or sentiment bias, time your entries with chart patterns, and always manage risk with tight invalidation zones and time-based stops. Over time, backtest your favorite setups on each currency pair, refine your parameters, and keep a trading journal to track which patterns perform best under different market conditions.
By combining these deep-dive pattern insights with disciplined risk controls, you’ll transform raw price data into actionable forecasts that guide your trades with clarity and confidence. Whether you’re scalping small moves or setting position-trade targets of 500 pips, mastering these chart patterns will elevate your forex forecasting and help you navigate any market environment.